Investor Presentation
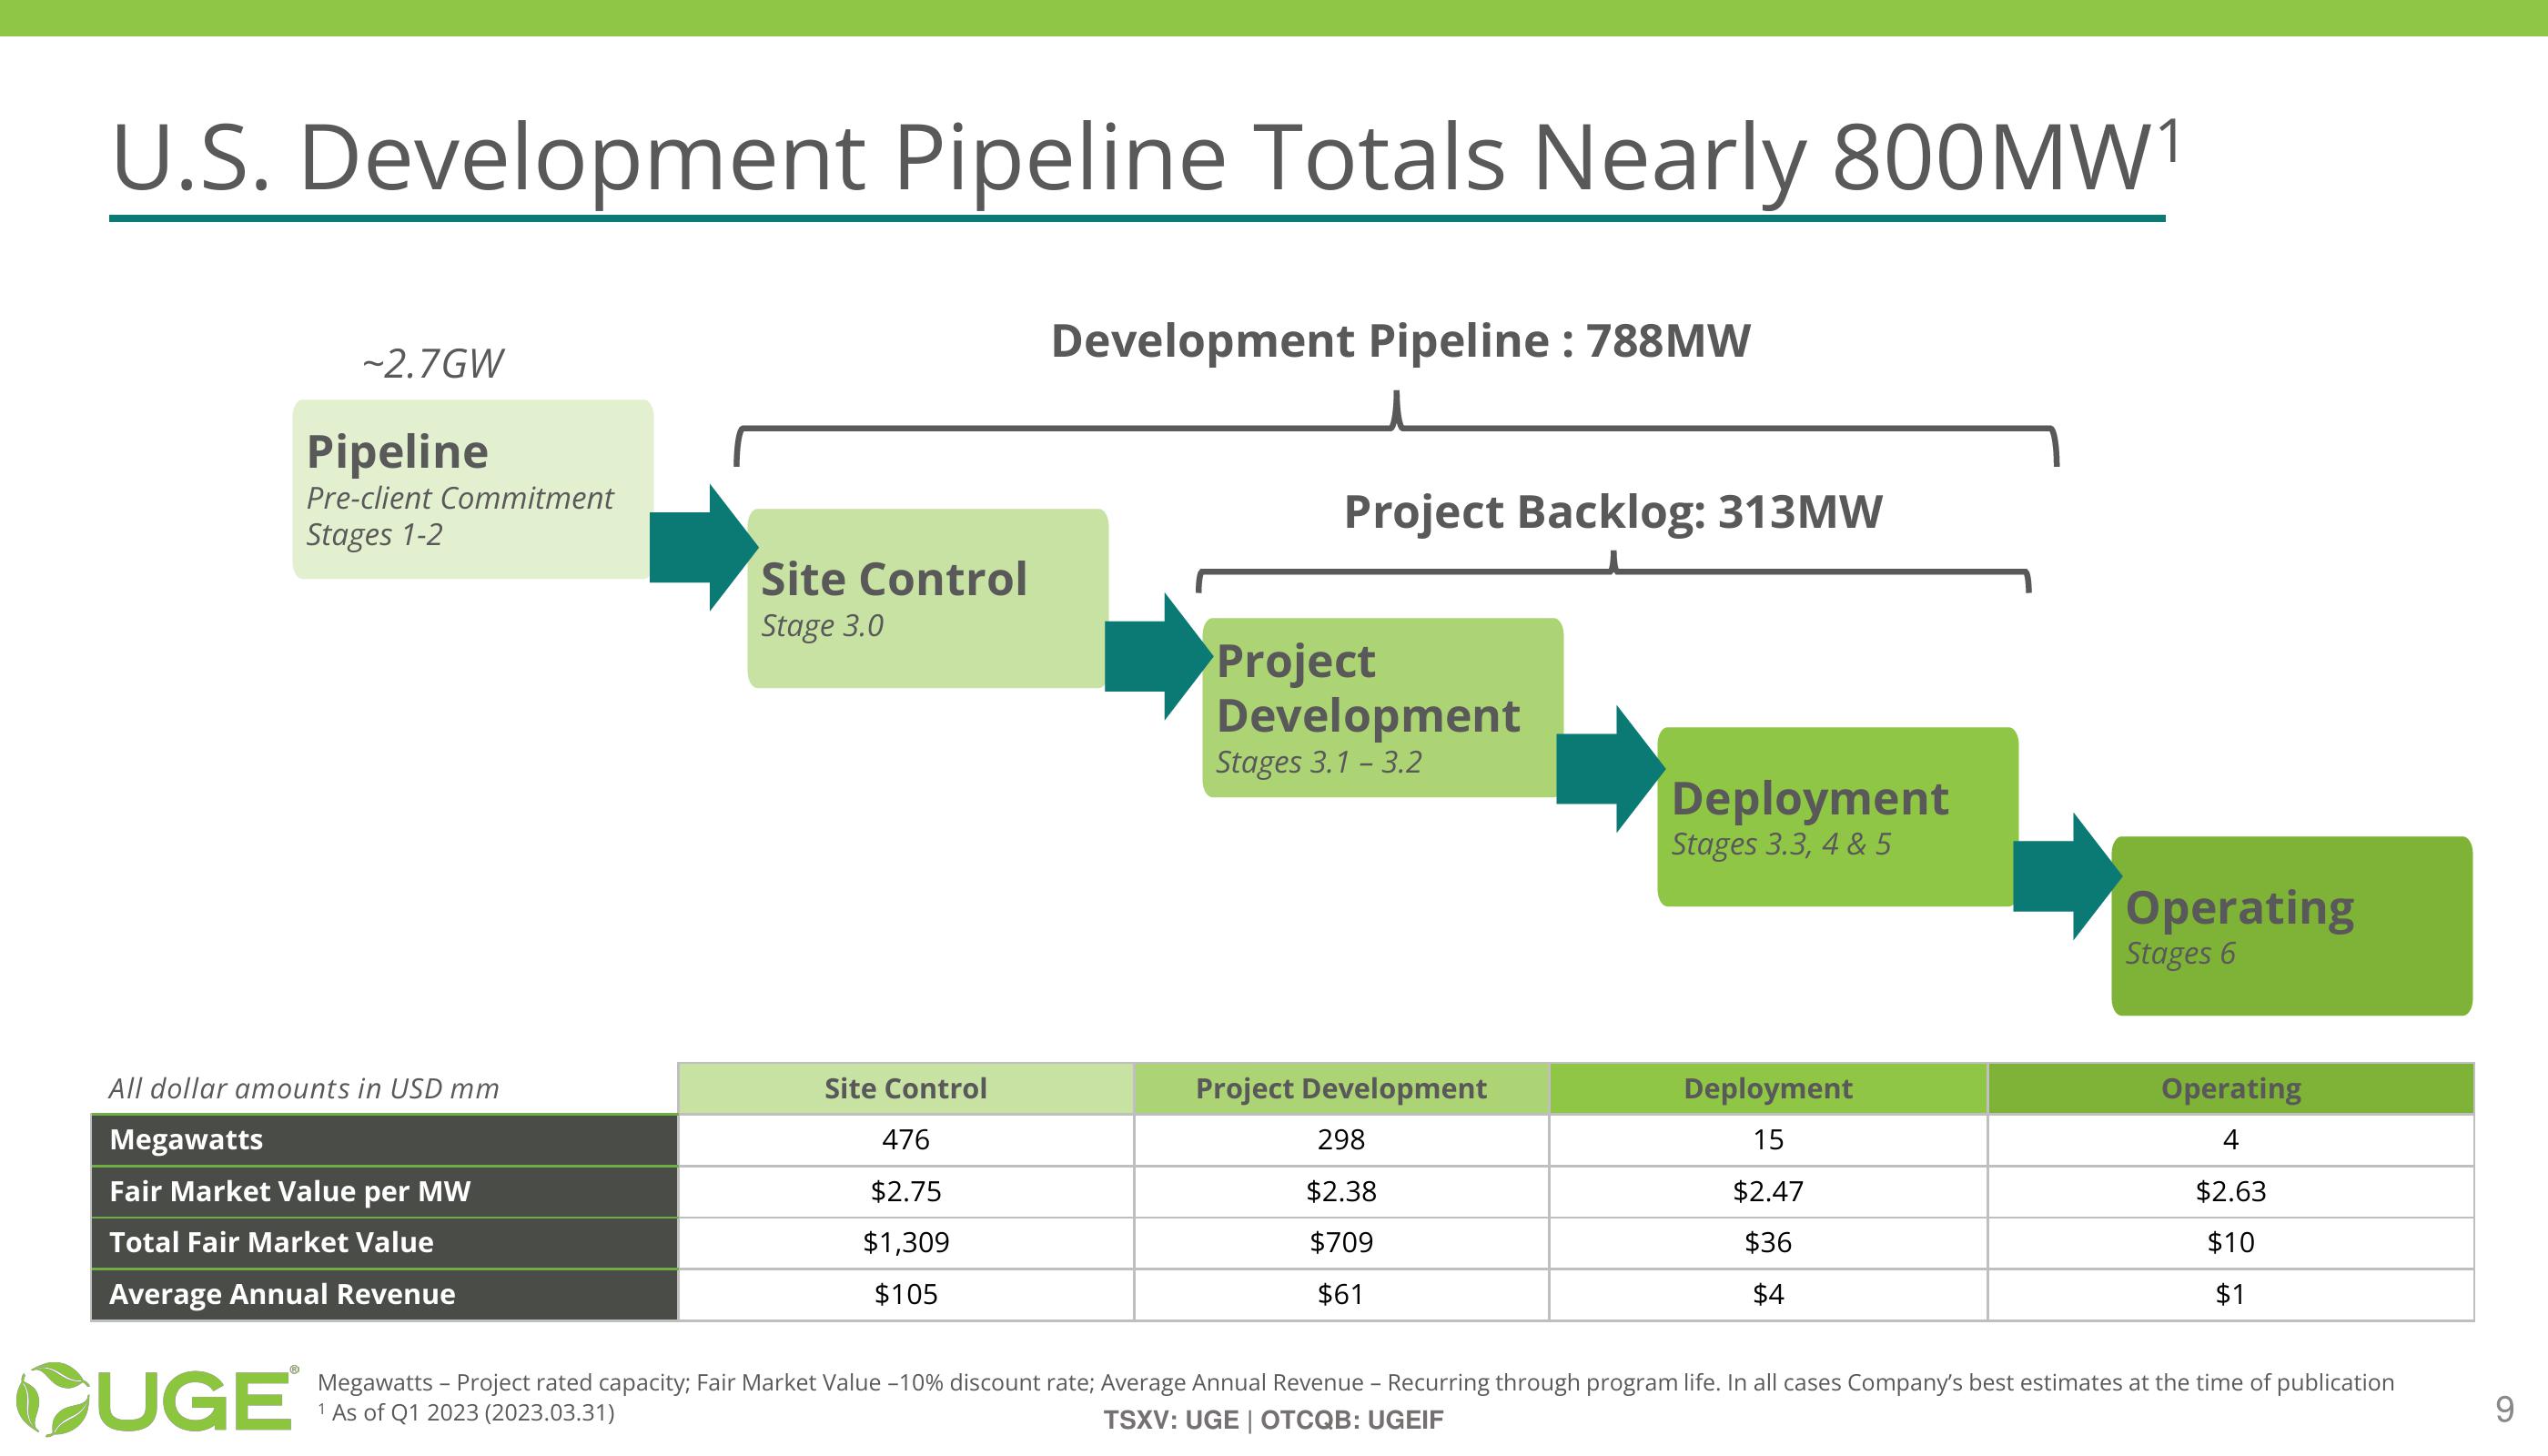
U.S. Development Pipeline Totals Nearly 800MW1
Development Pipeline: 788MW
~2.7GW
Pipeline
Pre-client Commitment
Stages 1-2
Site Control
Stage 3.0
Project Backlog: 313MW
Project
Development
Stages 3.1 - 3.2
Deployment
Stages 3.3, 4 & 5
Operating
Stages 6
All dollar amounts in USD mm
Megawatts
Fair Market Value per MW
Total Fair Market Value
Average Annual Revenue
UGE
Site Control
Project Development
Deployment
Operating
476
$2.75
298
15
4
$2.38
$2.47
$2.63
$709
$10
$61
$1
$1,309
$105
$36
$4
Megawatts - Project rated capacity; Fair Market Value -10% discount rate; Average Annual Revenue - Recurring through program life. In all cases Company's best estimates at the time of publication
1 As of Q1 2023 (2023.03.31)
TSXV: UGE | OTCQB: UGEIF
6View entire presentation