Antofagasta Results Presentation Deck
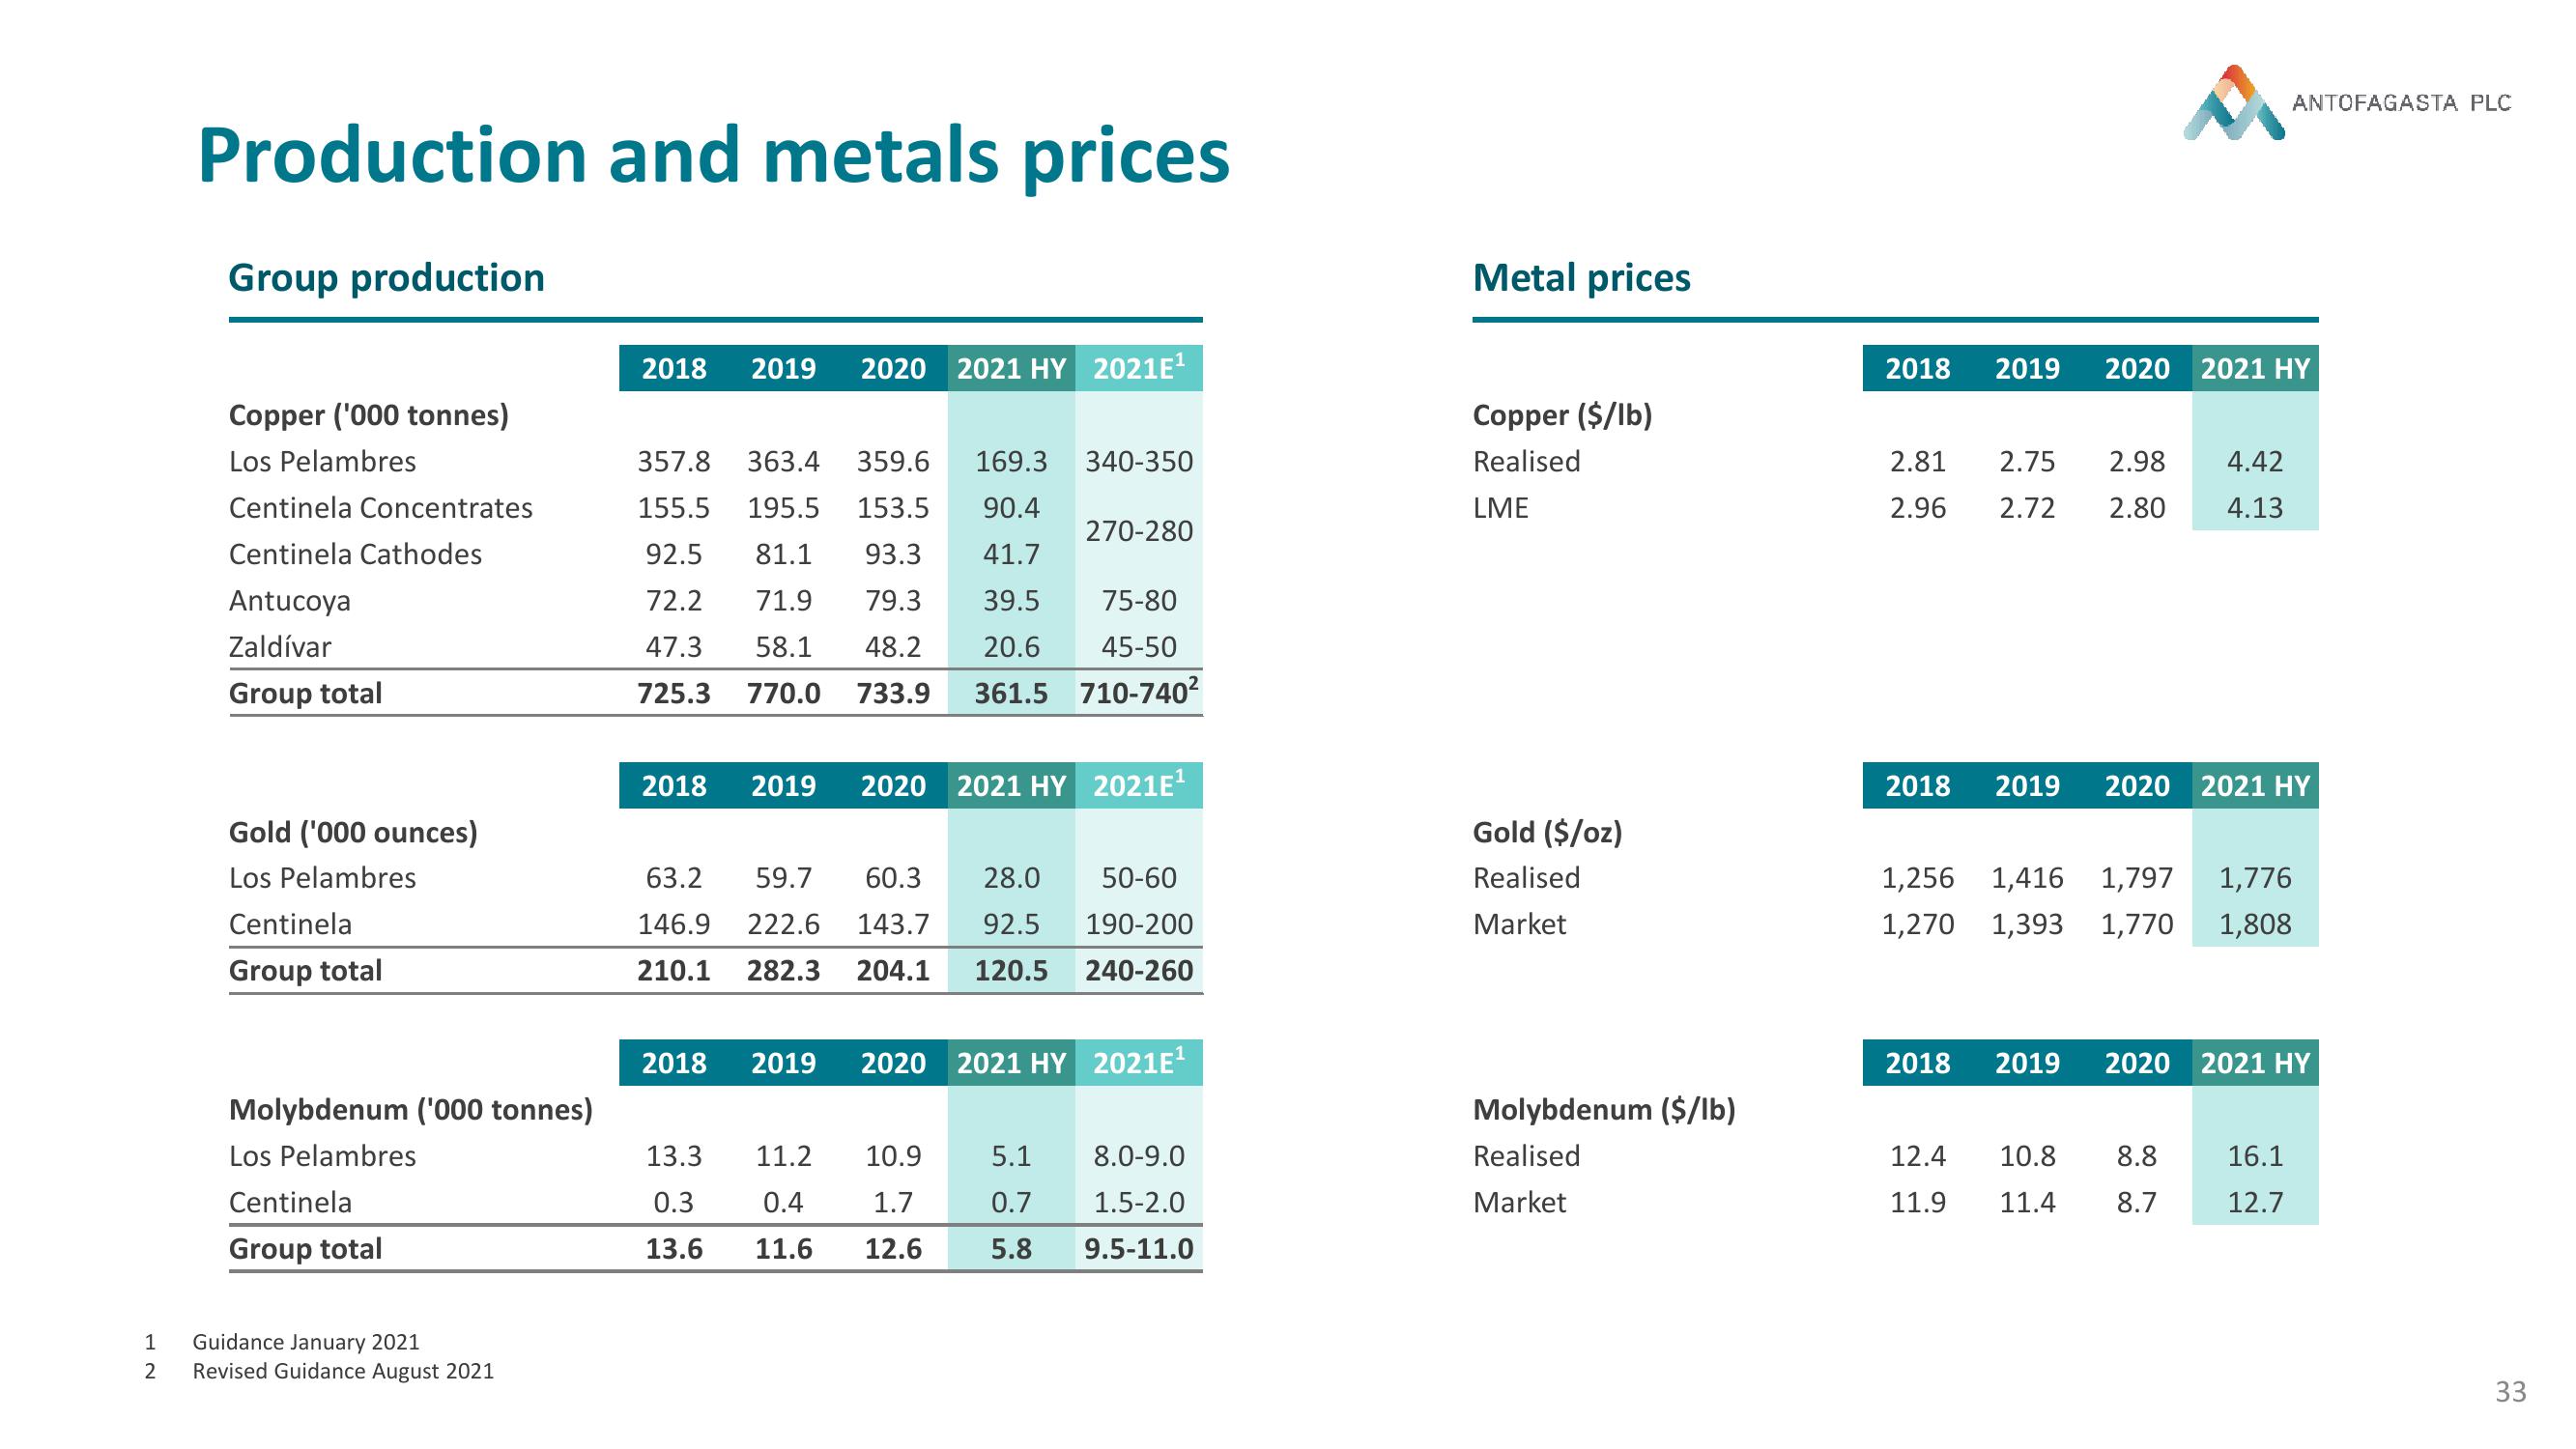
Production and metals prices
Group production
Copper ('000 tonnes)
Los Pelambres
Centinela Concentrates
Centinela Cathodes
Antucoya
Zaldívar
Group total
Gold ('000 ounces)
Los Pelambres
Centinela
Group total
Molybdenum ('000 tonnes)
Los Pelambres
Centinela
Group total
1 Guidance January 2021
2 Revised Guidance August 2021
2018 2019 2020 2021 HY 2021E¹
357.8 363.4 359.6 169.3 340-350
155.5 195.5 153.5 90.4
92.5
81.1 93.3 41.7
72.2
71.9 79.3
58.1 48.2
39.5
20.6
770.0 733.9 361.5 710-740²
75-80
45-50
47.3
725.3
2018 2019 2020 2021 HY 2021E¹
63.2 59.7 60.3 28.0 50-60
146.9 222.6 143.7 92.5 190-200
210.1 282.3 204.1 120.5 240-260
270-280
2018 2019 2020 2021 HY 2021E¹
13.3
0.3
13.6
11.2
0.4
11.6
10.9
1.7
12.6
5.1 8.0-9.0
1.5-2.0
0.7
5.8 9.5-11.0
Metal prices
Copper ($/lb)
Realised
LME
Gold ($/oz)
Realised
Market
Molybdenum ($/lb)
Realised
Market
2018 2019
2.81
2.96
2018
2.75
2.72
2019
2020 2021 HY
2.98 4.42
2.80 4.13
12.4 10.8
11.9 11.4
ANTOFAGASTA PLC
2020 2021 HY
1,256 1,416 1,797 1,776
1,270 1,393 1,770
1,808
2018 2019 2020 2021 HY
8.8
8.7
16.1
12.7
33View entire presentation