Cboe Results Presentation Deck
Fourth Quarter and Year Financial Overview
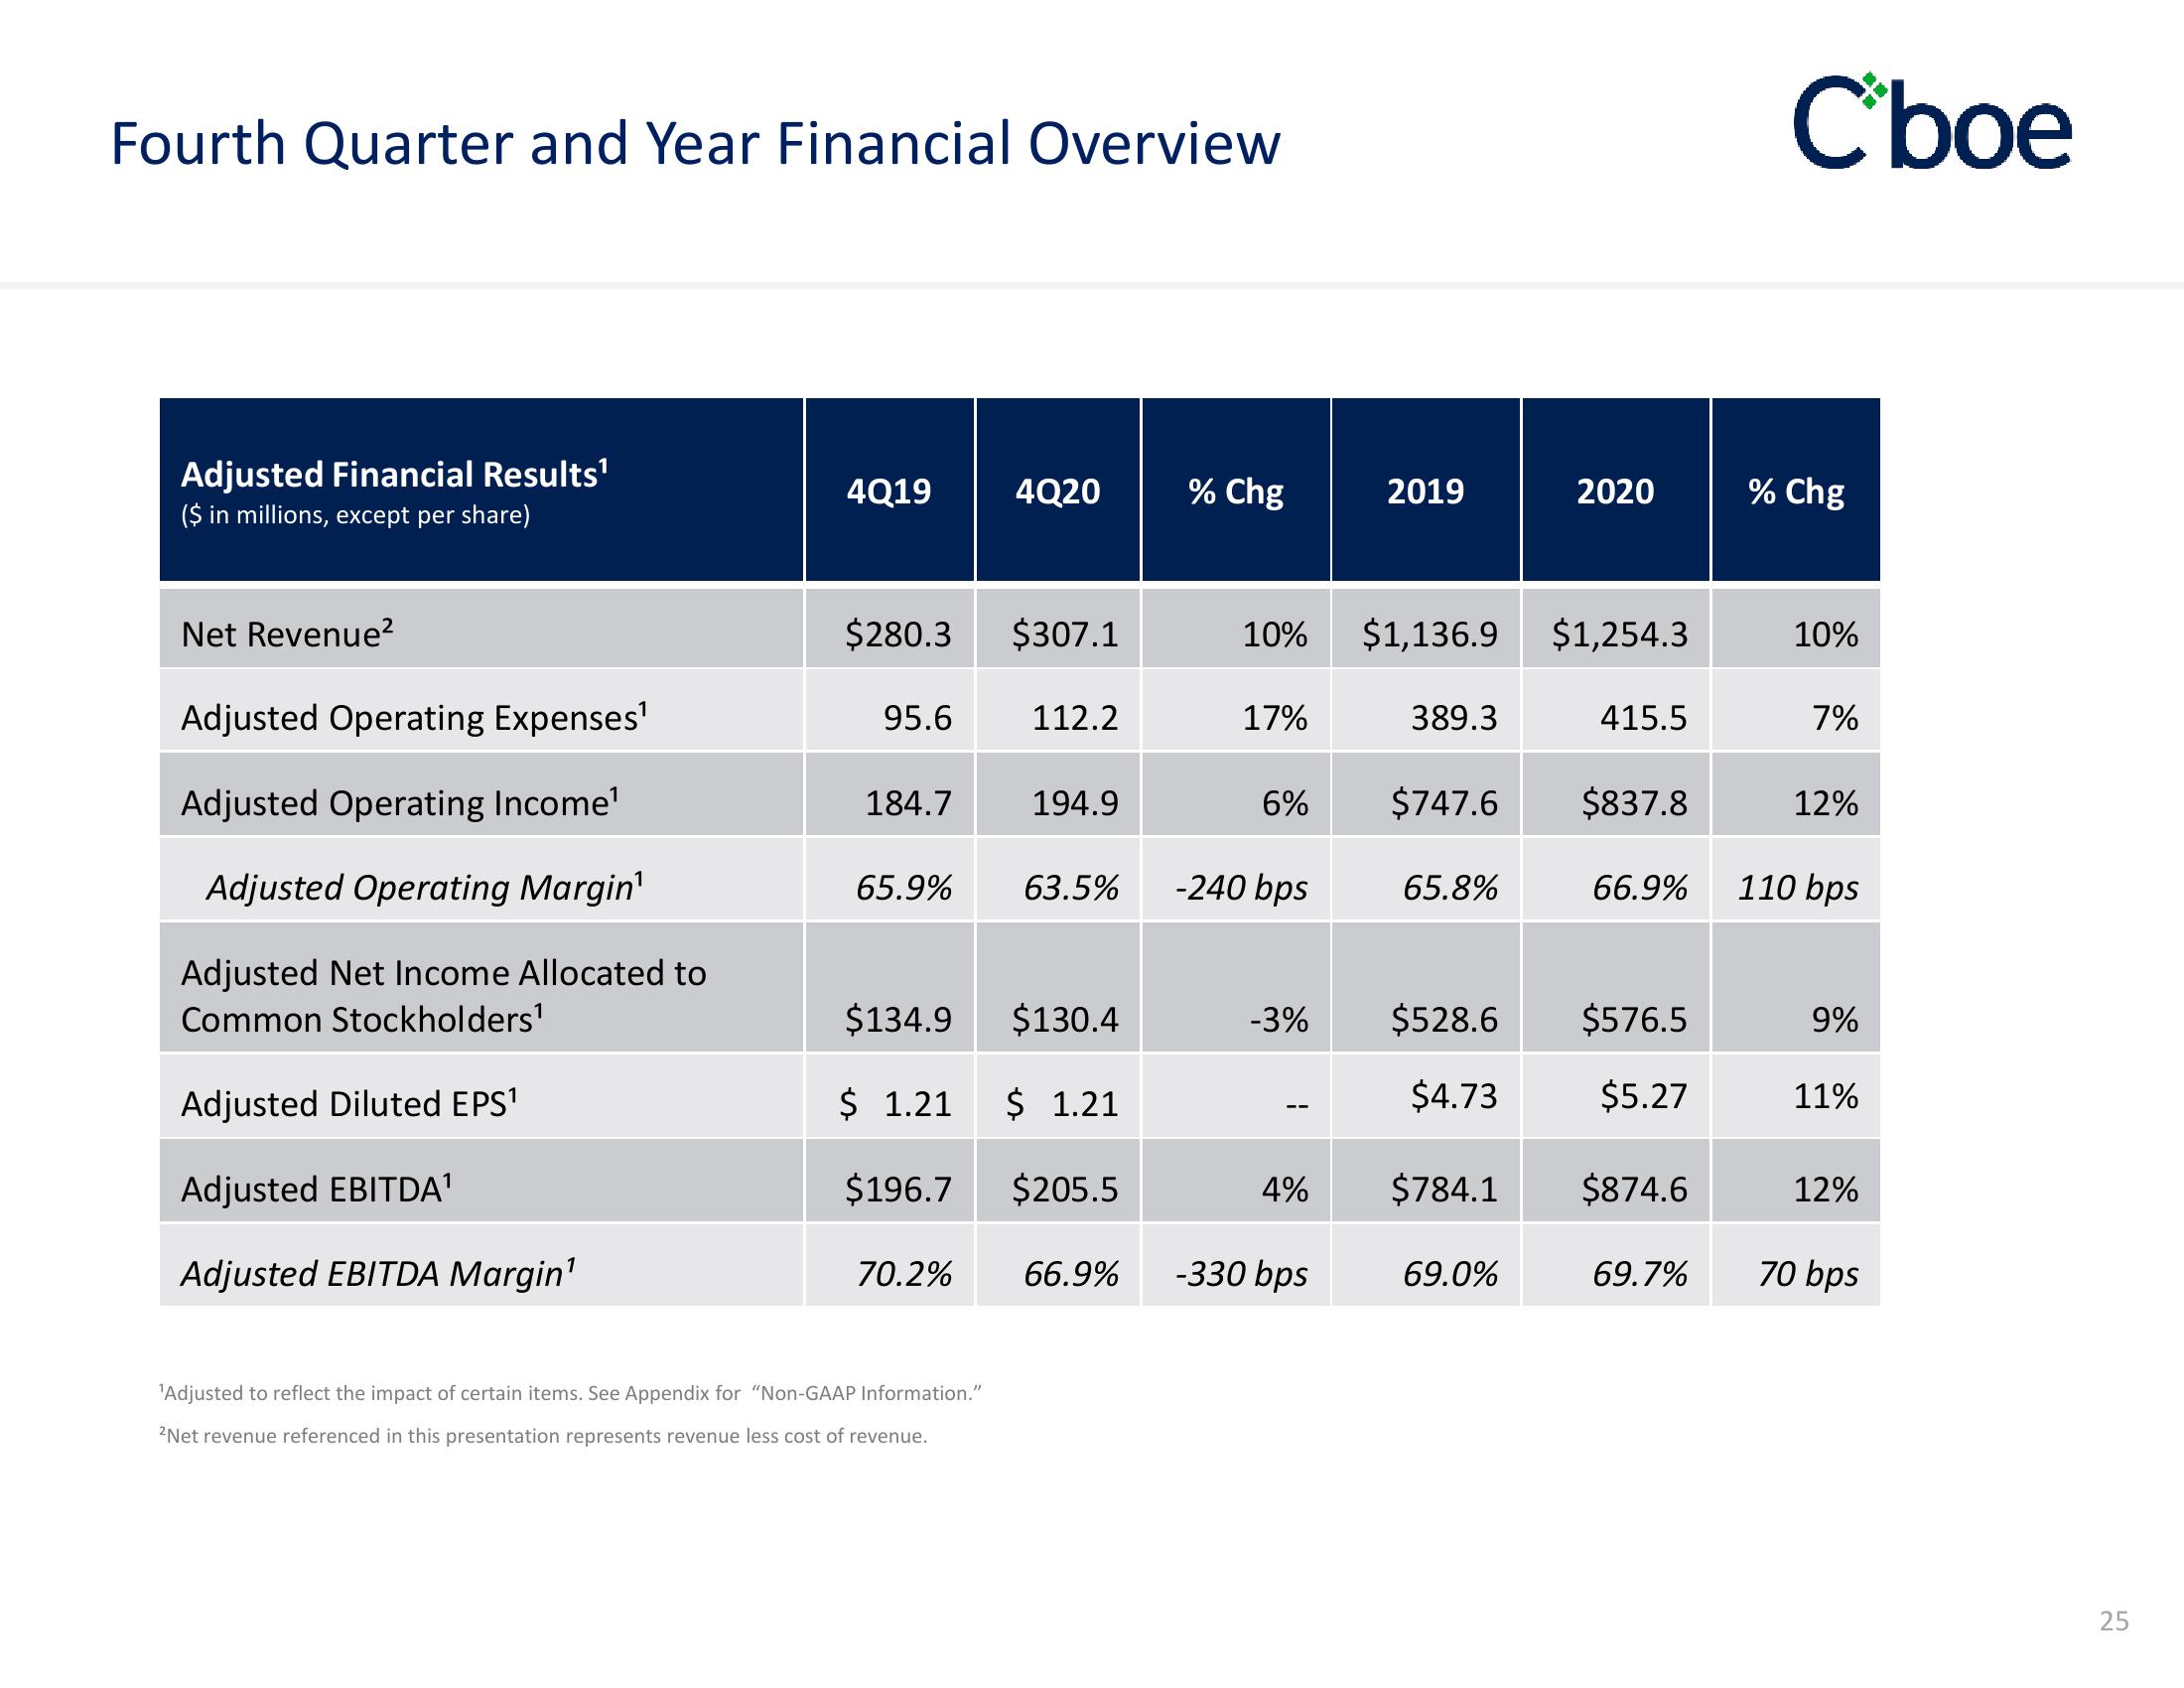
Adjusted Financial Results¹
($ in millions, except per share)
Net Revenue²
Adjusted Operating Expenses¹
Adjusted Operating Income¹
Adjusted Operating Margin¹
Adjusted Net Income Allocated to
Common Stockholders¹
Adjusted Diluted EPS¹
Adjusted EBITDA¹
Adjusted EBITDA Margin¹
4Q19 4Q20
$280.3 $307.1
95.6
184.7
65.9%
70.2%
112.2
¹Adjusted to reflect the impact of certain items. See Appendix for "Non-GAAP Information."
²Net revenue referenced in this presentation represents revenue less cost of revenue.
194.9
$134.9
$130.4
$ 1.21 $ 1.21
$196.7
$205.5
63.5%
66.9%
% Chg
10%
17%
6%
-240 bps
-3%
4%
-330 bps
2019
$1,136.9
389.3
$747.6
65.8%
$528.6
$4.73
$784.1
69.0%
2020
$1,254.3
415.5
$837.8
66.9%
$576.5
$5.27
$874.6
69.7%
C'boe
% Chg
10%
7%
12%
110 bps
9%
11%
12%
70 bps
25View entire presentation