ironSource SPAC Presentation Deck
Financial highlights
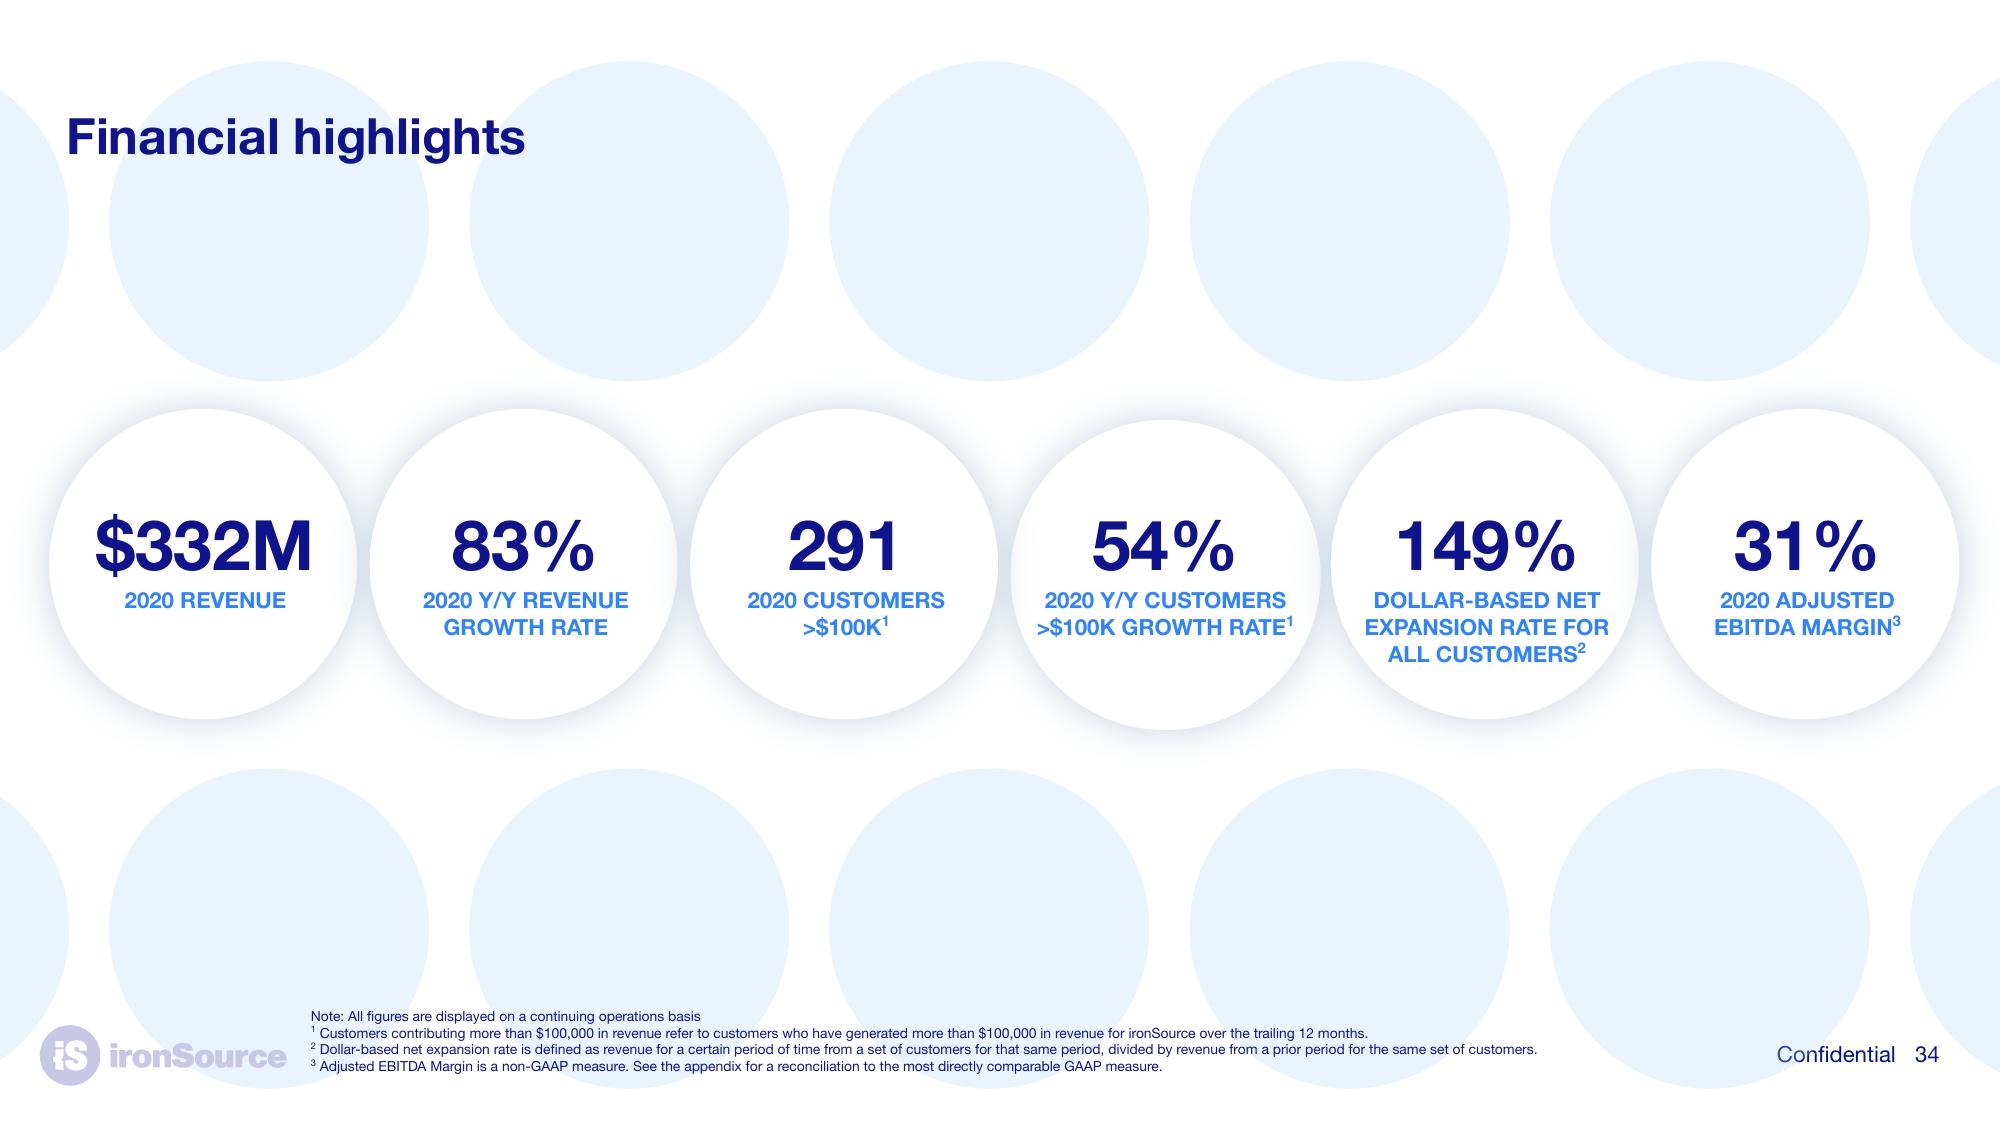
$332M
2020 REVENUE
iS ironSource
83%
2020 Y/Y REVENUE
GROWTH RATE
291
2020 CUSTOMERS
>$100K¹
54%
2020 Y/Y CUSTOMERS
>$100K GROWTH RATE¹
149%
DOLLAR-BASED NET
EXPANSION RATE FOR
ALL CUSTOMERS²
Note: All figures are displayed on a continuing operations basis
¹ Customers contributing more than $100,000 in revenue refer to customers who have generated more than $100,000 in revenue for ironSource over the trailing 12 months.
2 Dollar-based net expansion rate is defined as revenue for a certain period of time from a set of customers for that same period, divided by revenue from a prior period for the same set of customers.
3 Adjusted EBITDA Margin is a non-GAAP measure. See the appendix for a reconciliation to the most directly comparable GAAP measure.
31%
2020 ADJUSTED
EBITDA MARGIN³
Confidential 34View entire presentation