2nd Quarter 2021 Investor Presentation
Net Interest Income and Margin
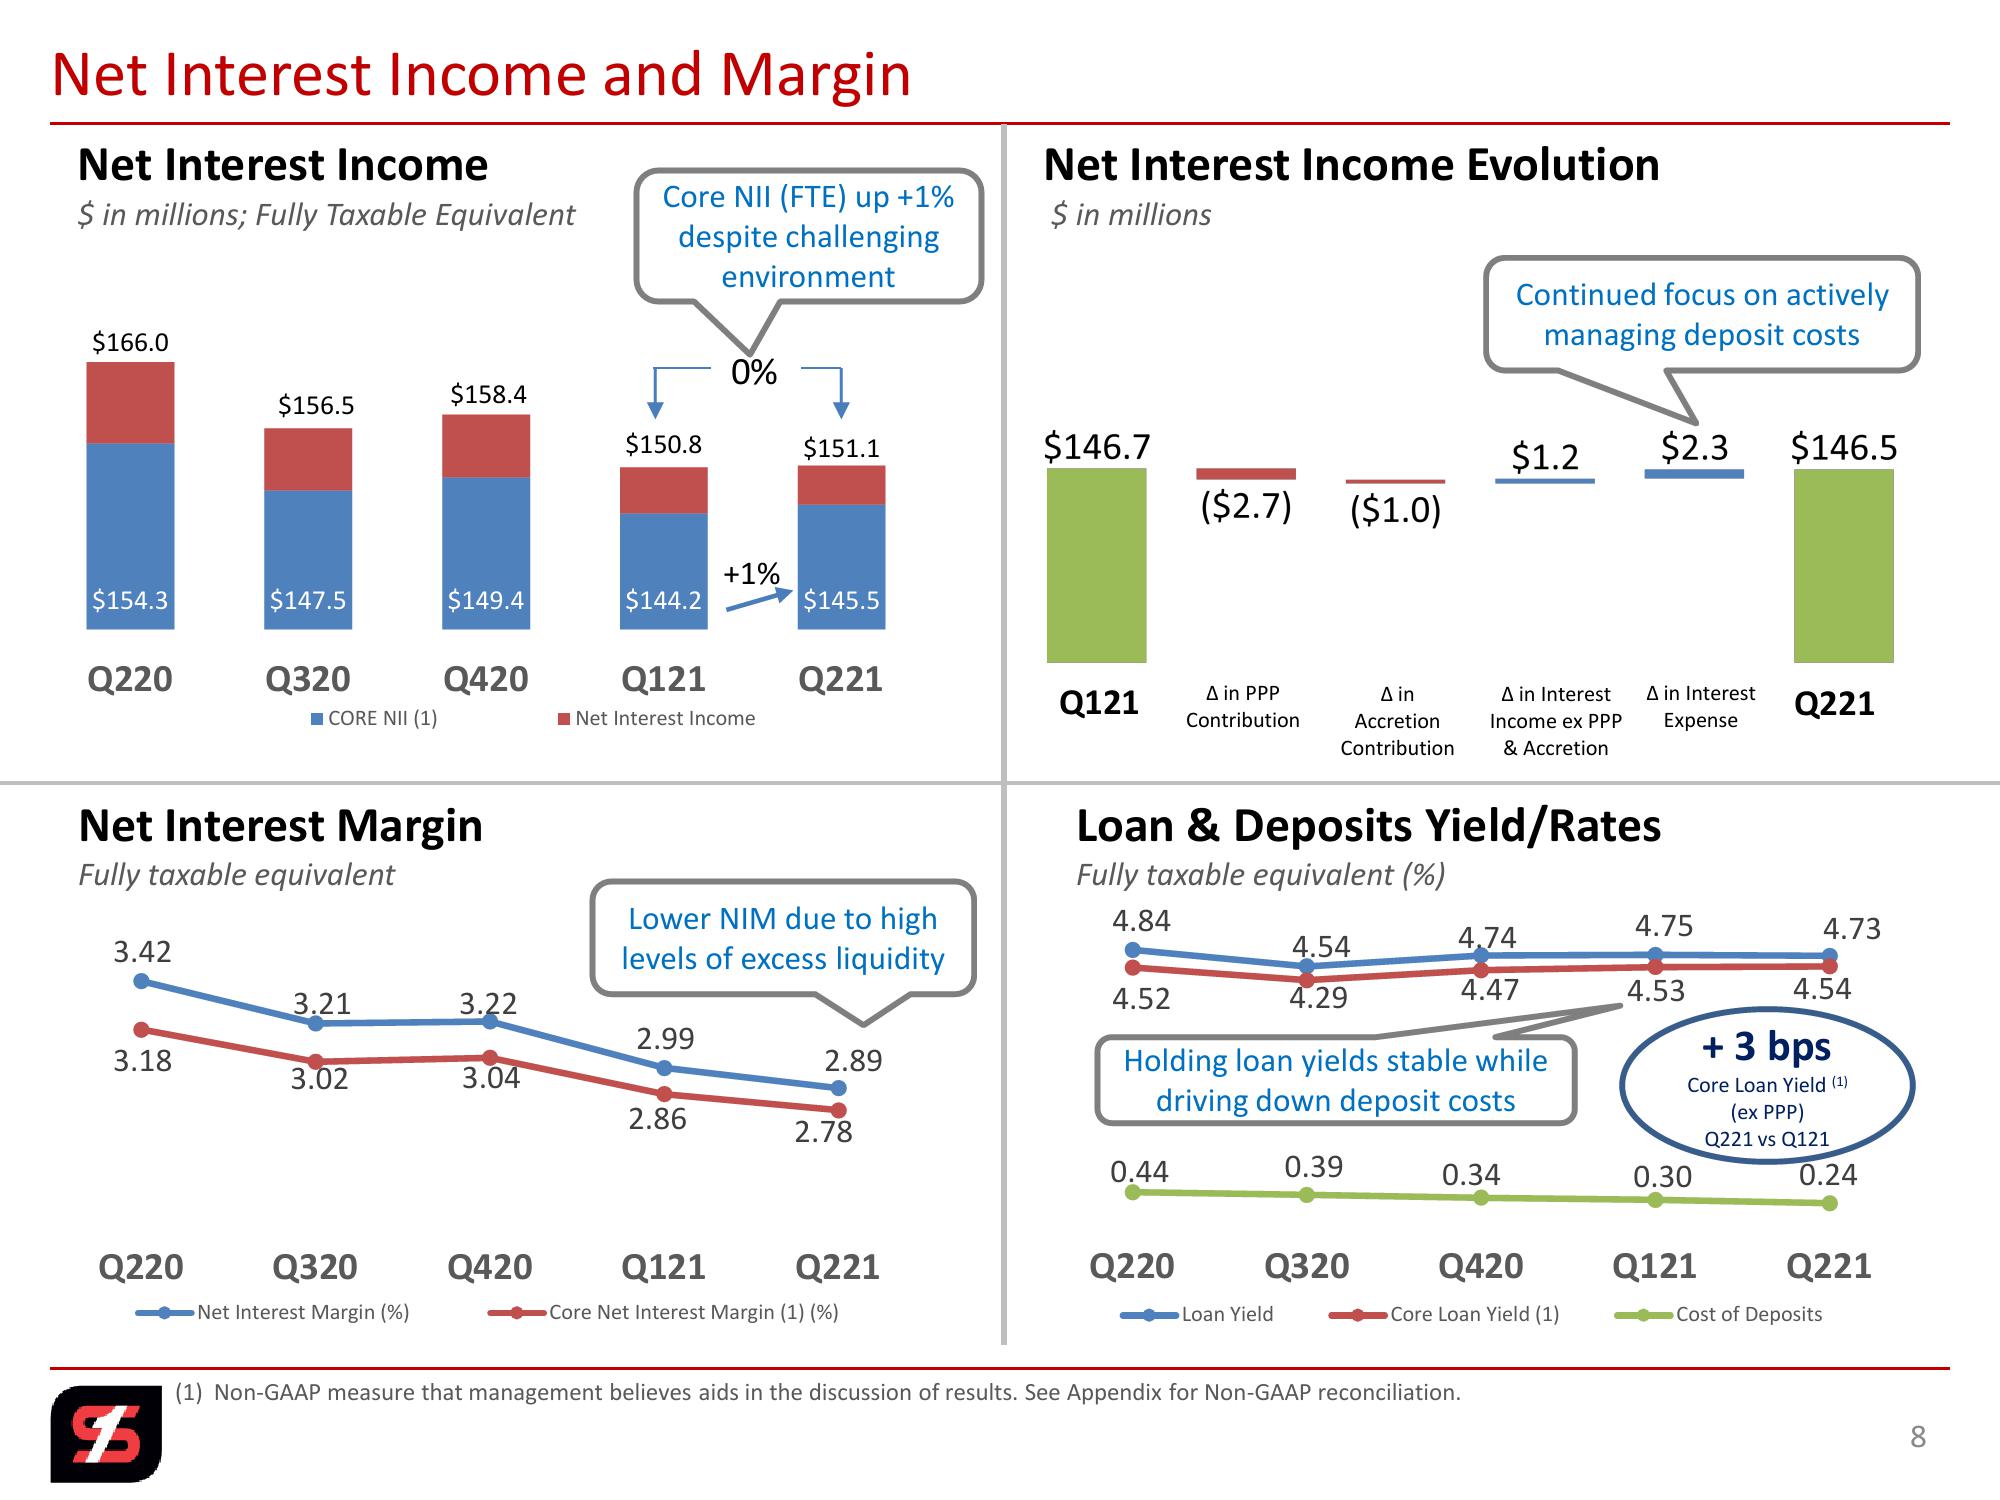
Net Interest Income
$ in millions; Fully Taxable Equivalent
Core NII (FTE) up +1%
despite challenging
environment
Net Interest Income Evolution
$ in millions
$166.0
$156.5
$158.4
$150.8
0%
Continued focus on actively
managing deposit costs
$151.1
$146.7
$1.2
$2.3
$146.5
($2.7) ($1.0)
+1%
$154.3
$147.5
$149.4
$144.2
$145.5
Q220
Q320
Q420
Q121
Q221
■CORE NII (1)
Q121
Net Interest Income
A in PPP
Contribution
A in
Accretion
Contribution
A in Interest
Income ex PPP
& Accretion
A in Interest
Expense
Q221
Net Interest Margin
Fully taxable equivalent
Lower NIM due to high
levels of excess liquidity
3.42
3.21
3.22
2.99
3.18
2.89
3.02
3.04
2.86
2.78
Loan & Deposits Yield/Rates
Fully taxable equivalent (%)
4.84
4.52
4.75
4.73
4.54
4.29
4.74
4.47
4.53
4.54
+ 3 bps
Holding loan yields stable while
driving down deposit costs
0.44
0.39
0.34
0.30
Core Loan Yield (1)
(ex PPP)
Q221 vs Q121
0.24
Q220
Q320
Net Interest Margin (%)
Q420
$
Q121
Q221
Core Net Interest Margin (1) (%)
Q220
Q320
Q420
Q121
Q221
Loan Yield
Core Loan Yield (1)
Cost of Deposits
(1) Non-GAAP measure that management believes aids in the discussion of results. See Appendix for Non-GAAP reconciliation.
8View entire presentation