Hubspot Results Presentation Deck
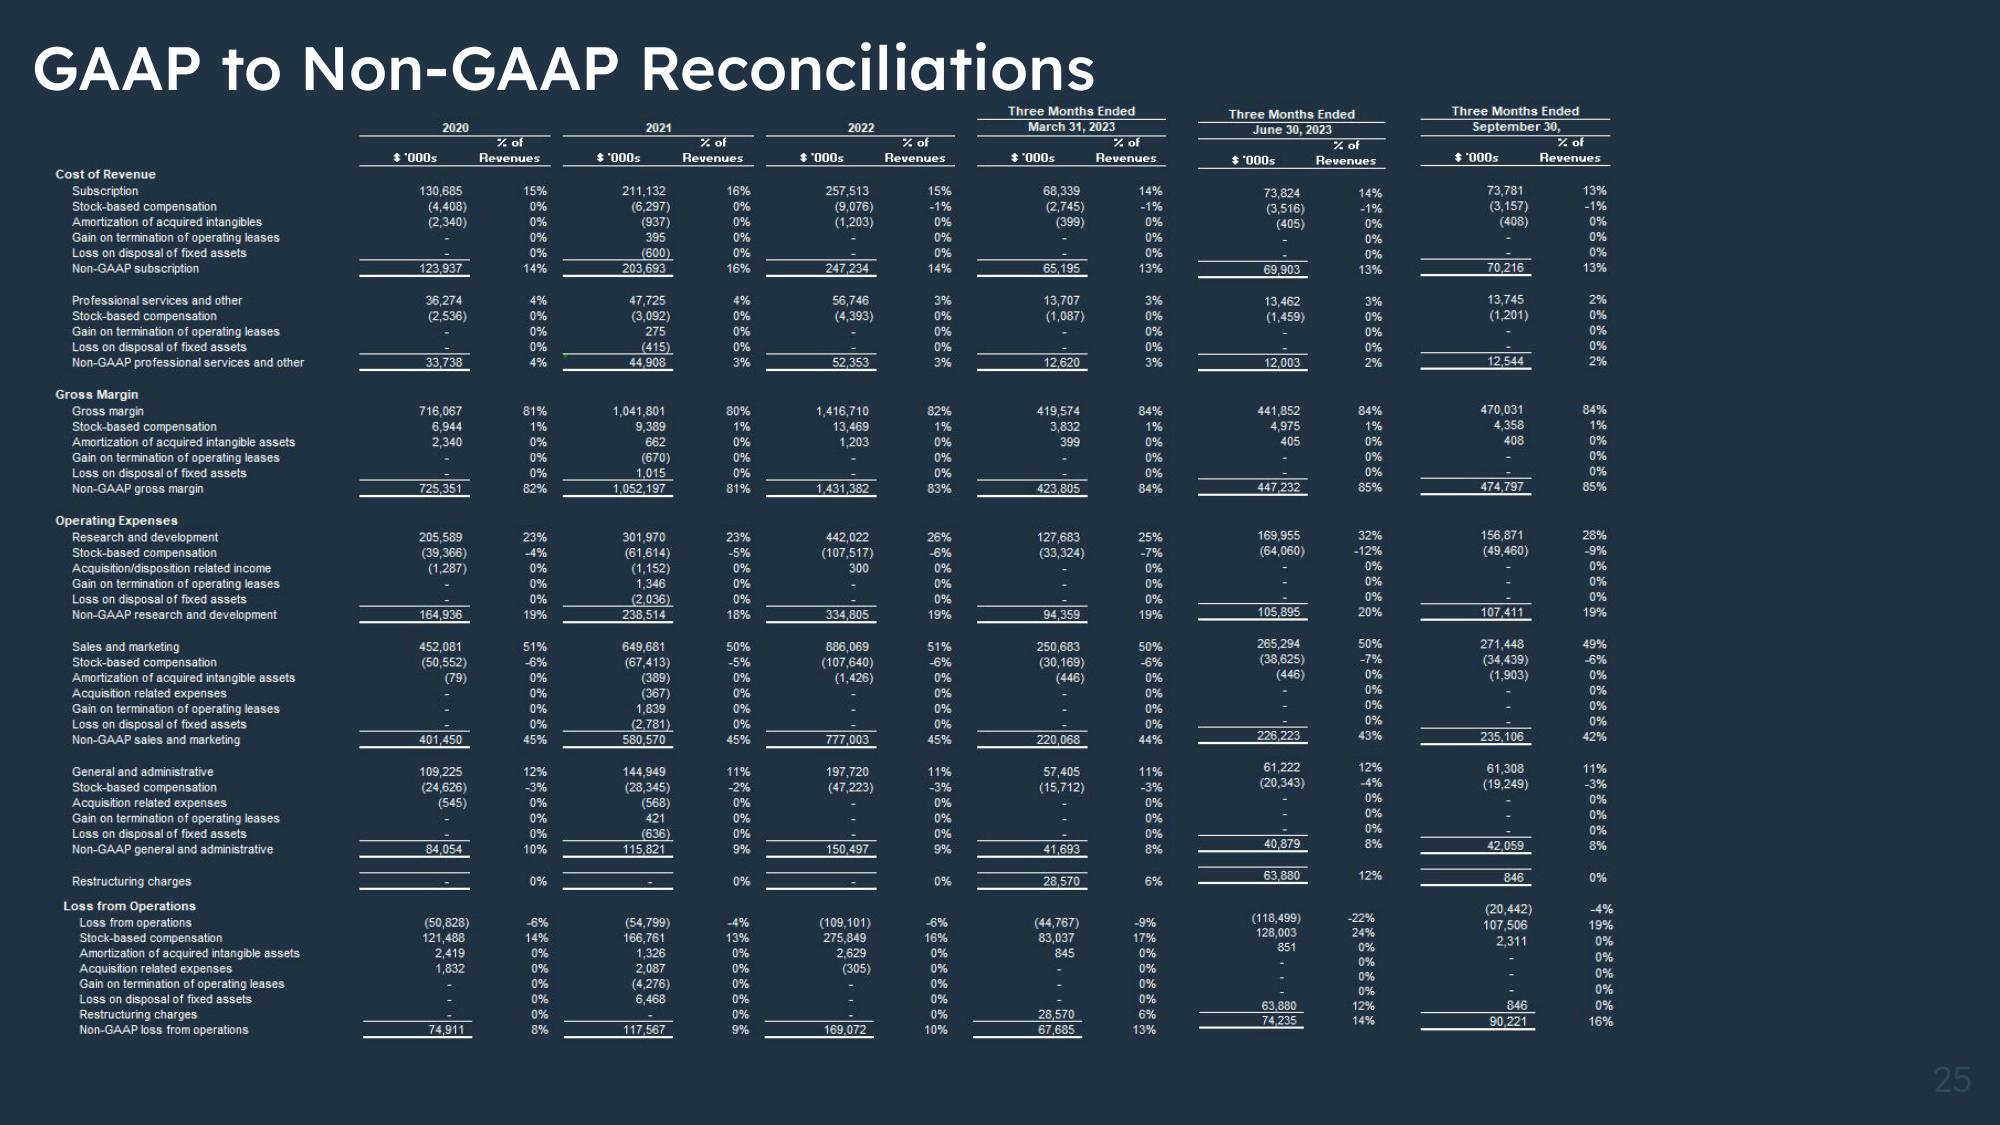
GAAP to Non-GAAP Reconciliations
Cost of Revenue
Subscription
Stock-based compensation
Amortization of acquired intangibles
Gain on termination of operating leases
Loss on disposal of fixed assets
Non-GAAP subscription
Professional services and other
Stock-based compensation
Gain on termination of operating leases
Loss on disposal of fixed assets
Non-GAAP professional services and other
Gross Margin
Gross margin
Stock-based compensation
Amortization of acquired intangible assets
Gain on termination of operating leases
Loss on disposal of fixed assets
Non-GAAP gross margin
Operating Expenses
Research and development
Stock-based compensation
Acquisition/disposition related income
Gain on termination of operating leases
Loss on disposal of fixed assets
Non-GAAP research and development
Sales and marketing
Stock-based compensation
Amortization of acquired intangible assets
Acquisition related expenses
Gain on termination of operating leases
Loss on disposal of fixed assets
Non-GAAP sales and marketing
General and administrative
Stock-based compensation
Acquisition related expenses
Gain on termination of operating leases
Loss on disposal of fixed assets
Non-GAAP general and administrative
Restructuring charges
Loss from Operations
Loss from operations
Stock-based compensation
Amortization of acquired intangible assets
Acquisition related expenses
Gain on termination of operating leases
Loss on disposal of fixed assets
Restructuring charges
Non-GAAP loss from operations
$ '000s
2020
130,685
(4,408)
(2,340)
123.937
36,274
(2,536)
33,738
716,067
6,944
2,340
725,351
205,589
(39,366)
(1,287)
164,936
452,081
(50,552)
(79)
401.450
109,225
(24,626)
(545)
84,054
(50,828)
121,488
2,419
1,832
74.911
% of
Revenues
15%
0%
0%
0%
0%
14%
4%
0%
0%
0%
4%
81%
1%
0%
0%
0%
82%
23%
-4%
0%
0%
0%
19%
51%
-6%
0%
0%
0%
0%
45%
12%
-3%
0%
0%
0%
10%
0%
-6%
14%
0%
0%
0%
0%
0%
8%
$ '000s
2021
211,132
(6,297)
(937)
395
11
(600)
203,693
47,725
(3,092)
275
(415)
44,908
1,041,801
9,389
662
(670)
1,015
1,052,197
301,970
(61,614)
(1,152)
1,346
(2.036)
238,514
649,681
(67,413)
(389)
(367)
1,839
(2,781)
580,570
144,949
(28,345)
(568)
421
(636)
115,821
(54,799)
166,761
1,326
2,087
(4,276)
6,468
117,567
% of
Revenues
16%
0%
0%
0%
0%
16%
4%
0%
0%
0%
3%
80%
1%
0%
0%
0%
81%
23%
-5%
0%
0%
0%
18%
50%
-5%
0%
0%
0%
0%
45%
11%
-2%
0%
0%
0%
9%
0%
-4%
13%
0%
0%
0%
0%
0%
9%
$ '000s
2022
257,513
(9,076)
(1,203)
P
247,234
56,746
(4,393)
52,353
1,416,710
13,469
1,203
1,431,382
442,022
(107,517)
300
334,805
886,069
(107,640)
(1,426)
777,003
197,720
(47,223)
150,497
(109,101)
275,849
2,629
(305)
169,072
% of
Revenues
15%
-1%
0%
0%
0%
14%
3%
0%
0%
0%
3%
82%
1%
0%
0%
0%
83%
26%
-6%
0%
0%
0%
19%
51%
-6%
0%
0%
0%
0%
45%
11%
-3%
0%
0%
0%
9%
0%
-6%
16%
0%
0%
0%
0%
0%
10%
Three Months Ended
March 31, 2023
$'000s
68,339
(2,745)
(399)
65,195
13,707
(1,087)
12,620
419,574
3,832
399
423,805
127,683
(33,324)
94,359
250,683
(30,169)
(446)
220,068
57,405
(15,712)
41,693
28,570
(44,767)
83,037
845
28,570
67,685
% of
Revenues
14%
-1%
0%
0%
0%
13%
3%
0%
0%
0%
3%
84%
1%
0%
0%
0%
84%
25%
-7%
0%
0%
0%
19%
50%
-6%
0%
0%
0%
0%
44%
11%
-3%
0%
0%
0%
8%
6%
-9%
17%
0%
0%
0%
0%
6%
13%
Three Months Ended
June 30, 2023
% of
Revenues
$'000s
73,824
(3,516)
(405)
69,903
13,462
(1,459)
12,003
441,852
4,975
405
447,232
169,955
(64,060)
105,895
265,294
(38,625)
(446)
226,223
61,222
(20,343)
40,879
63,880
(118.499)
128,003
851
63,880
74,235
14%
-1%
0%
0%
0%
13%
3%
0%
0%
0%
2%
84%
1%
0%
0%
0%
85%
32%
-12%
0%
0%
0%
20%
50%
-7%
0%
0%
0%
0%
43%
12%
-4%
0%
0%
0%
8%
12%
-22%
24%
0%
0%
0%
0%
12%
14%
Three Months Ended
September 30,
$ '000s
73,781
(3,157)
(408)
70,216
13,745
(1,201)
12,544
470,031
4,358
408
474,797
156,871
(49,460)
107,411
271,448
(34,439)
(1,903)
235,106
61,308
(19,249)
42,059
846
(20,442)
107,506
2,311
846
90,221
% of
Revenues
13%
-1%
0%
0%
0%
13%
2%
0%
0%
0%
2%
84%
1%
0%
0%
0%
85%
28%
-9%
0%
0%
0%
19%
49%
-6%
0%
0%
0%
0%
42%
11%
-3%
0%
0%
0%
8%
0%
-4%
19%
0%
0%
0%
0%
0%
16%
25View entire presentation