J.P.Morgan Investment Banking Pitch Book
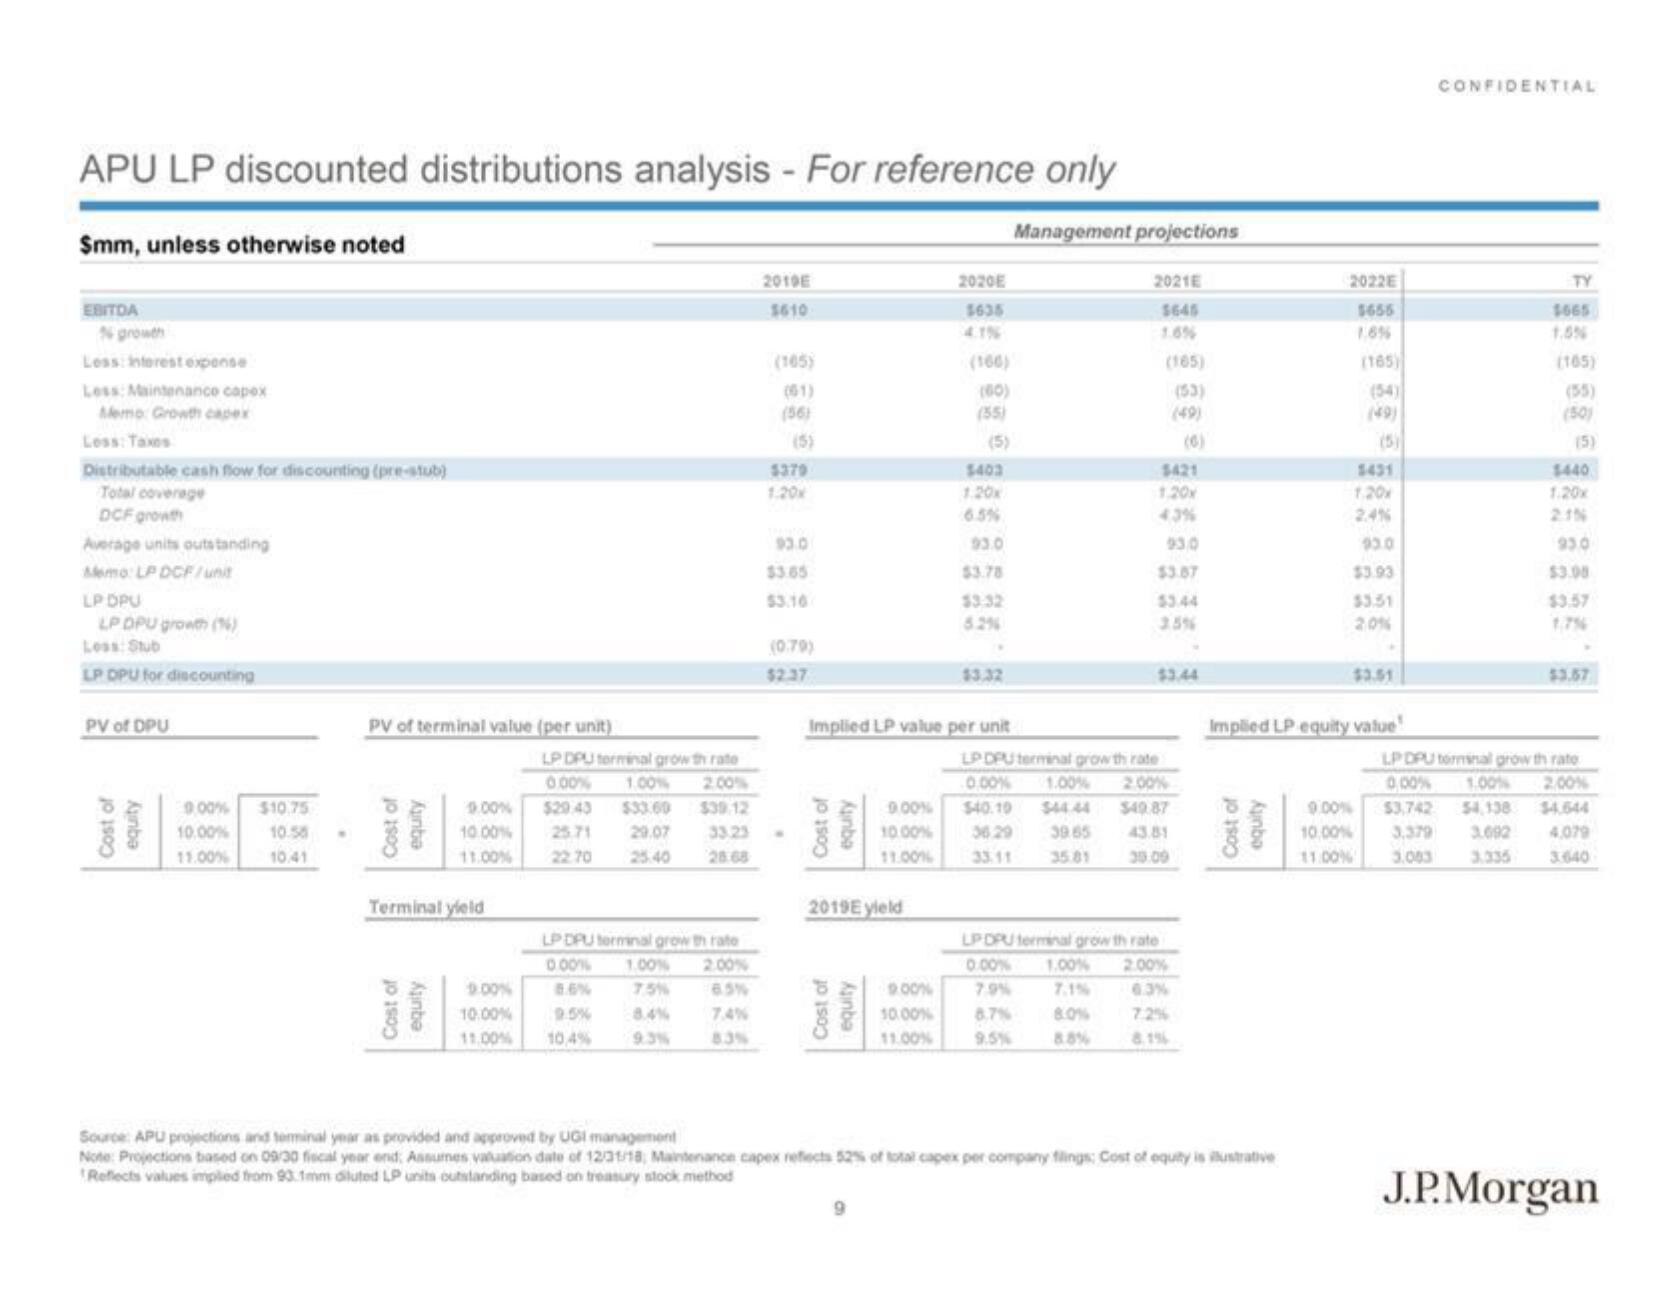
APU LP discounted distributions analysis - For reference only
$mm, unless otherwise noted
EBITDA
Ngrowth
Less interest expense
Less: Maintenance capex
Memo: Growth capex
Less: Taxes
Distributable cash flow for discounting (pre-stub)
Total coverage
DCF growth
Average units outstanding
Memo: LP DCF/unit
LP DPU
LP DPU growth (1)
Less: Stub
LP DPU for discounting
PV of DPU
Cost of
Kunbe
9.00% $10.75
10.00%
10.58
11.00%
10.41
PV of terminal value (per unit)
Cost of
Aunba
Cost of
Terminal yield
Anbe
LP DPU terminal growth rate
0.00% 1.00% 2.00%
9.00% $29.43
10.00% 25.71
11.00% 22.70
$33.60 $39.12
29.07 33.23
25:40
LPDPU terminal growth rate
0.00%
1.00% 2.00%
9.00%
10.00%
9.5%
11.00% 10,4%
8.4%
7.4%
83%
2010E
5610
(165)
(56)
(5)
$379
1.20
93.0
$3.65
$3.16
(0.79)
$2.37
Cost of
Kunba
Cost of
2019E yield
Implied LP value per unit
Asinba
9.00%
10.00%
11.00%
9
2020E
1635
9.00%
10.00%
11.00%
(166)
(80)
(55)
(5)
$403
93.0
$3.78
$3.32
Management projections
2021E
5645
(165)
(53)
(49)
8.0%
8.8%
$421
1,20x
93.0
$3.87
53.44
35%
LPDPU terminal growth rate
0.00% 1.00% 2.00%
$40.10 $44.44 $49.87
36.29 39.65
33.11
35.81
30.09
LPDPU terminal growth rate
0.00% 1.00% 2.00%
7.9%
0.3%
8.7%
9.5%
8.1%
Cost of
Aunbo
Source: APU projections and terminal year as provided and approved by UGI management
Note: Projections based on 09/30 fiscal year end; Assumes valuation date of 12/31/18, Maintenance capex reflects 52% of total capex per company flings: Cost of equity is ilustrative
Reflects values implied from 93.1mm diluted LP units outstanding based on treasury stock method
2022E
5655
(165)
(54)
Implied LP equity value
(5)
1,20x
2.4%
93.0
$3.93
$3.51
20%
$3.51
9.00%
10.00%
11.00%
CONFIDENTIAL
TY
1665
1.5%
(165)
(55)
(50)
(5)
$440
1.20x
93.0
$3.08
$3.57
1.7%
LP DPU torminal growth rate
0,00% 1.00% 2.00%
$3,742 54,138 $4.644
3.379 3.692 4,079
3.003
3.335
3.640
J.P. MorganView entire presentation