Pathward Financial Results Presentation Deck
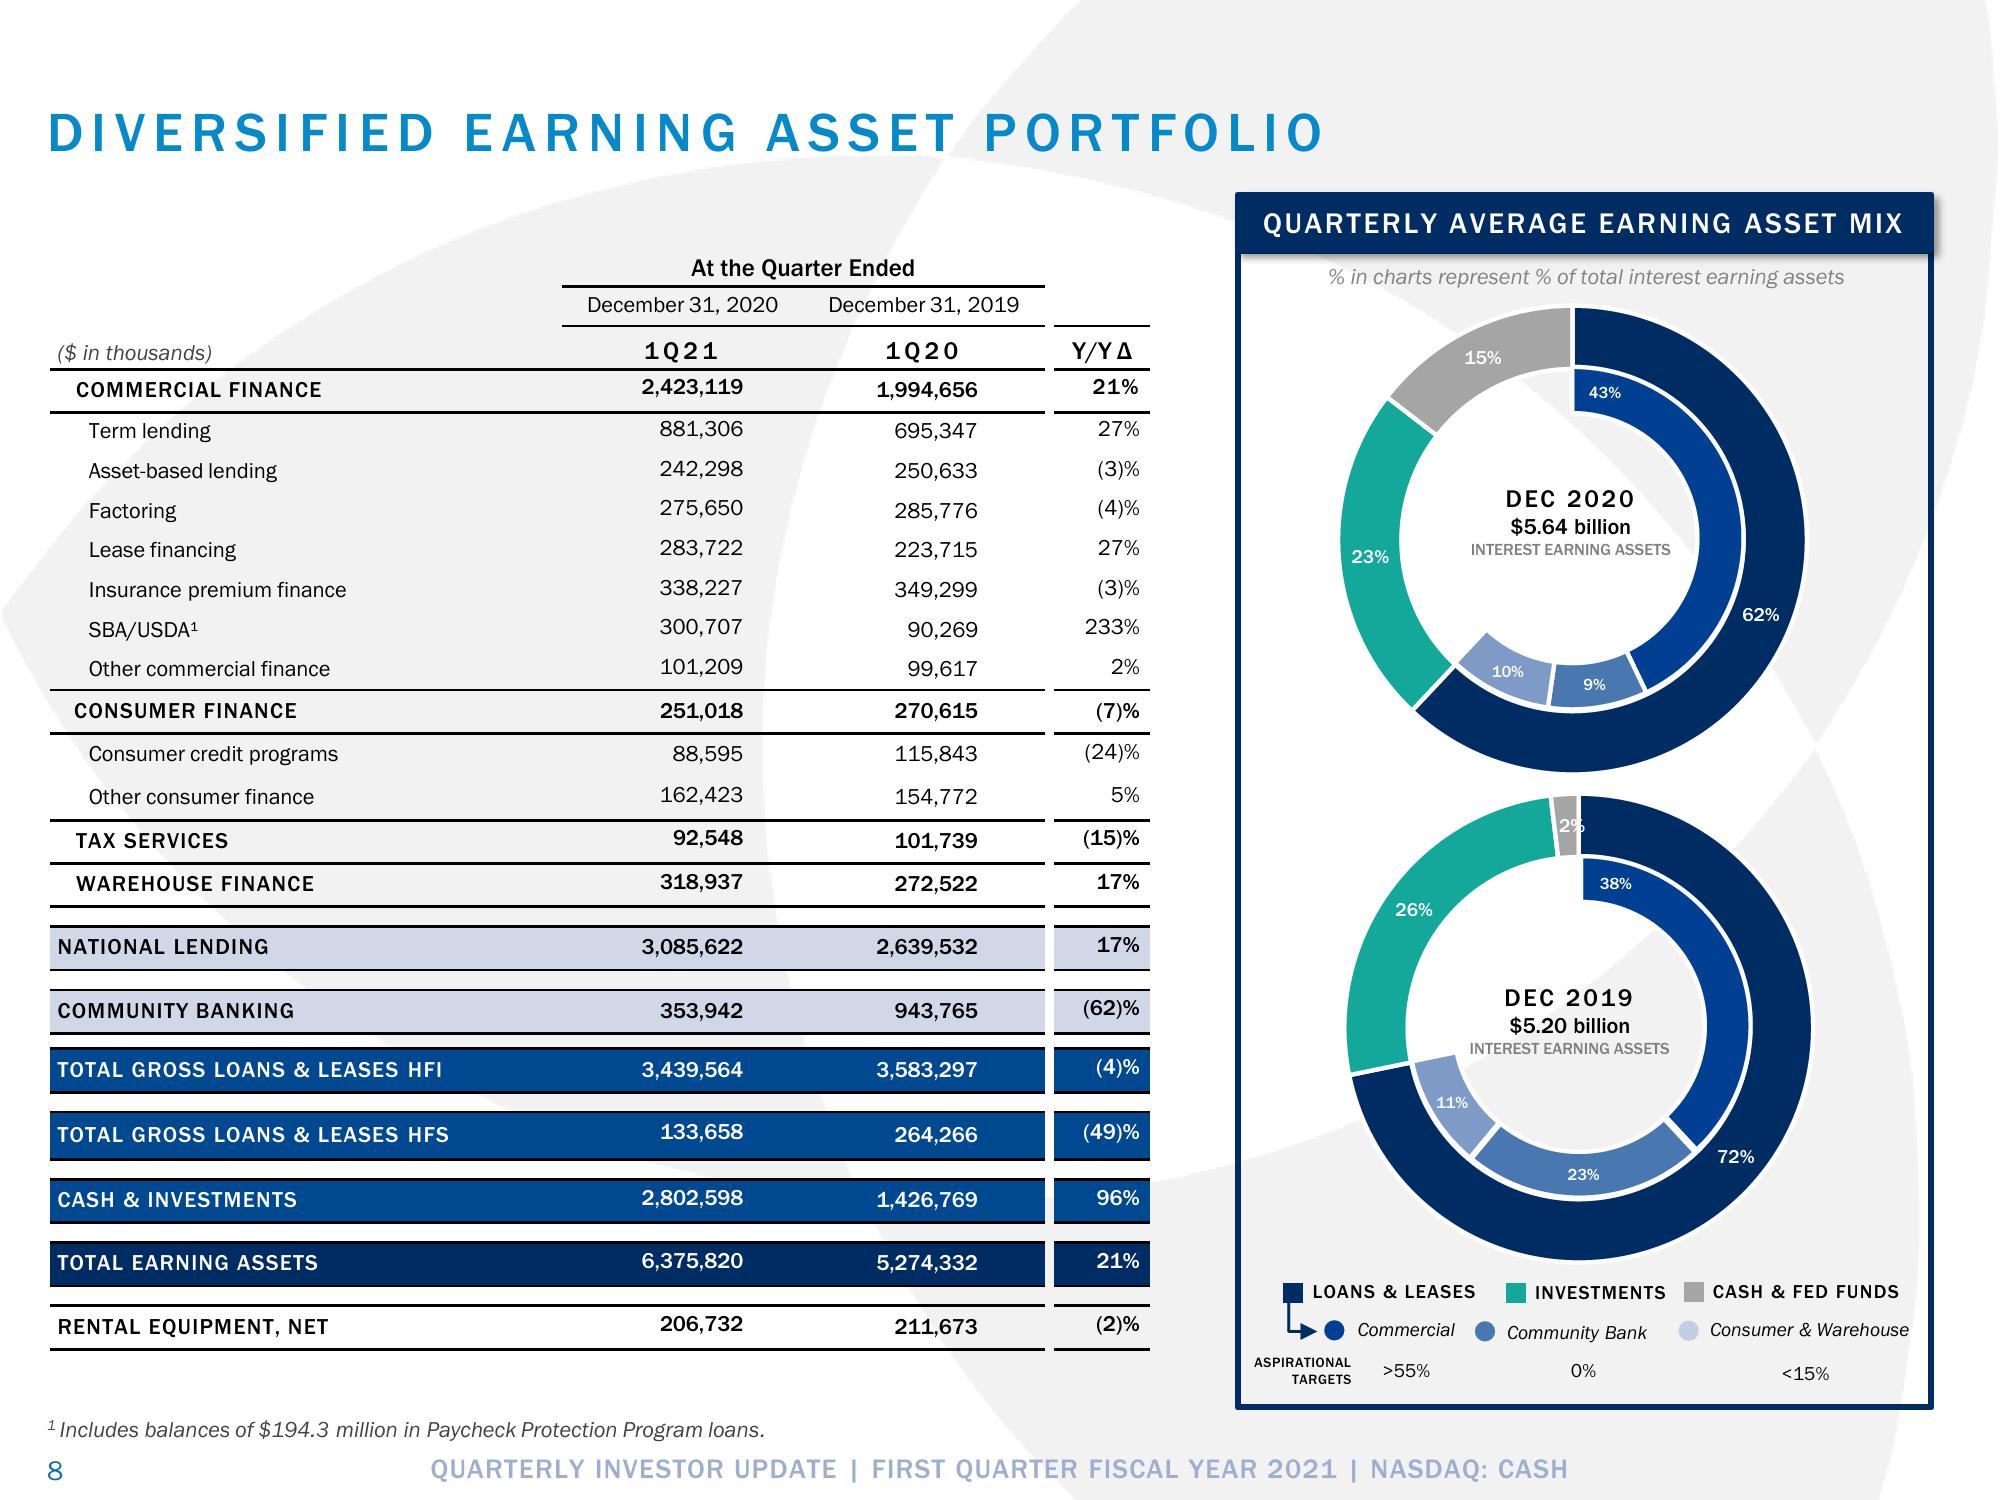
DIVERSIFIED EARNING ASSET PORTFOLIO
($ in thousands)
COMMERCIAL FINANCE
Term lending
Asset-based lending
Factoring
Lease financing
Insurance premium finance
SBA/USDA¹
Other commercial finance
CONSUMER FINANCE
Consumer credit programs
Other consumer finance
TAX SERVICES
WAREHOUSE FINANCE
NATIONAL LENDING
COMMUNITY BANKING
TOTAL GROSS LOANS & LEASES HFI
TOTAL GROSS LOANS & LEASES HFS
CASH & INVESTMENTS
TOTAL EARNING ASSETS
RENTAL EQUIPMENT, NET
At the Quarter Ended
December 31, 2020
1021
2,423,119
881,306
242,298
275,650
283,722
338,227
300,707
101,209
251,018
88,595
162,423
92,548
318,937
3,085,622
353,942
3,439,564
133,658
2,802,598
6,375,820
206,732
¹ Includes balances of $194.3 million in Paycheck Protection Program loans.
8
December 31, 2019
1Q20
1,994,656
695,347
250,633
285,776
223,715
349,299
90,269
99,617
270,615
115,843
154,772
101,739
272,522
2,639,532
943,765
3,583,297
264,266
1,426,769
5,274,332
211,673
Y/YA
21%
27%
(3)%
(4)%
27%
(3)%
233%
2%
(7)%
(24)%
5%
(15)%
17%
17%
(62)%
(4)%
(49)%
96%
21%
(2)%
QUARTERLY AVERAGE EARNING ASSET MIX
% in charts represent % of total interest earning assets
23%
26%
ASPIRATIONAL
TARGETS
15%
11%
Commercial
>55%
LOANS & LEASES
DEC 2020
$5.64 billion
INTEREST EARNING ASSETS
10%
№
2%
43%
9%
DEC 2019
$5.20 billion
INTEREST EARNING ASSETS
QUARTERLY INVESTOR UPDATE | FIRST QUARTER FISCAL YEAR 2021 | NASDAQ: CASH
23%
38%
INVESTMENTS
Community Bank
0%
62%
72%
CASH & FED FUNDS
Consumer & Warehouse
<15%View entire presentation