Legend Biotech Results Presentation Deck
11
2023 3Q and YTD Financial Summary
($MM)
Cash and Cash Equivalents, Time
Deposits, and Short-Term Investments
($MM)
License revenue
Collaboration revenue
Other revenue
Total revenue
Collaboration cost of revenue
Research and development
expenses
Administrative expenses
Selling and distribution expenses
LOSS FOR THE PERIOD
September 30, 2023
3Q 2023
20
76
0
96
-43
-96
-28
-21
-62
1,428
3Q 2022
0
27
0
27
-25
-105
-23
-19
-85
Y/Y change
178%
-69%
251%
71%
-8%
21%
June 30, 2023
12%
-27%
This presentation is for investor relations purposes only - Not for product promotional purposes
1,519
YTD 2023 YTD 2022
35
170
0
206
-112
-277
-78
-60
-373
50
39
0
89
March 31, 2023
-42
-255
-54
-68
-310
854
Y/Y change
-30%
334%
1%
130%
164%
8%
45%
-11%
20%
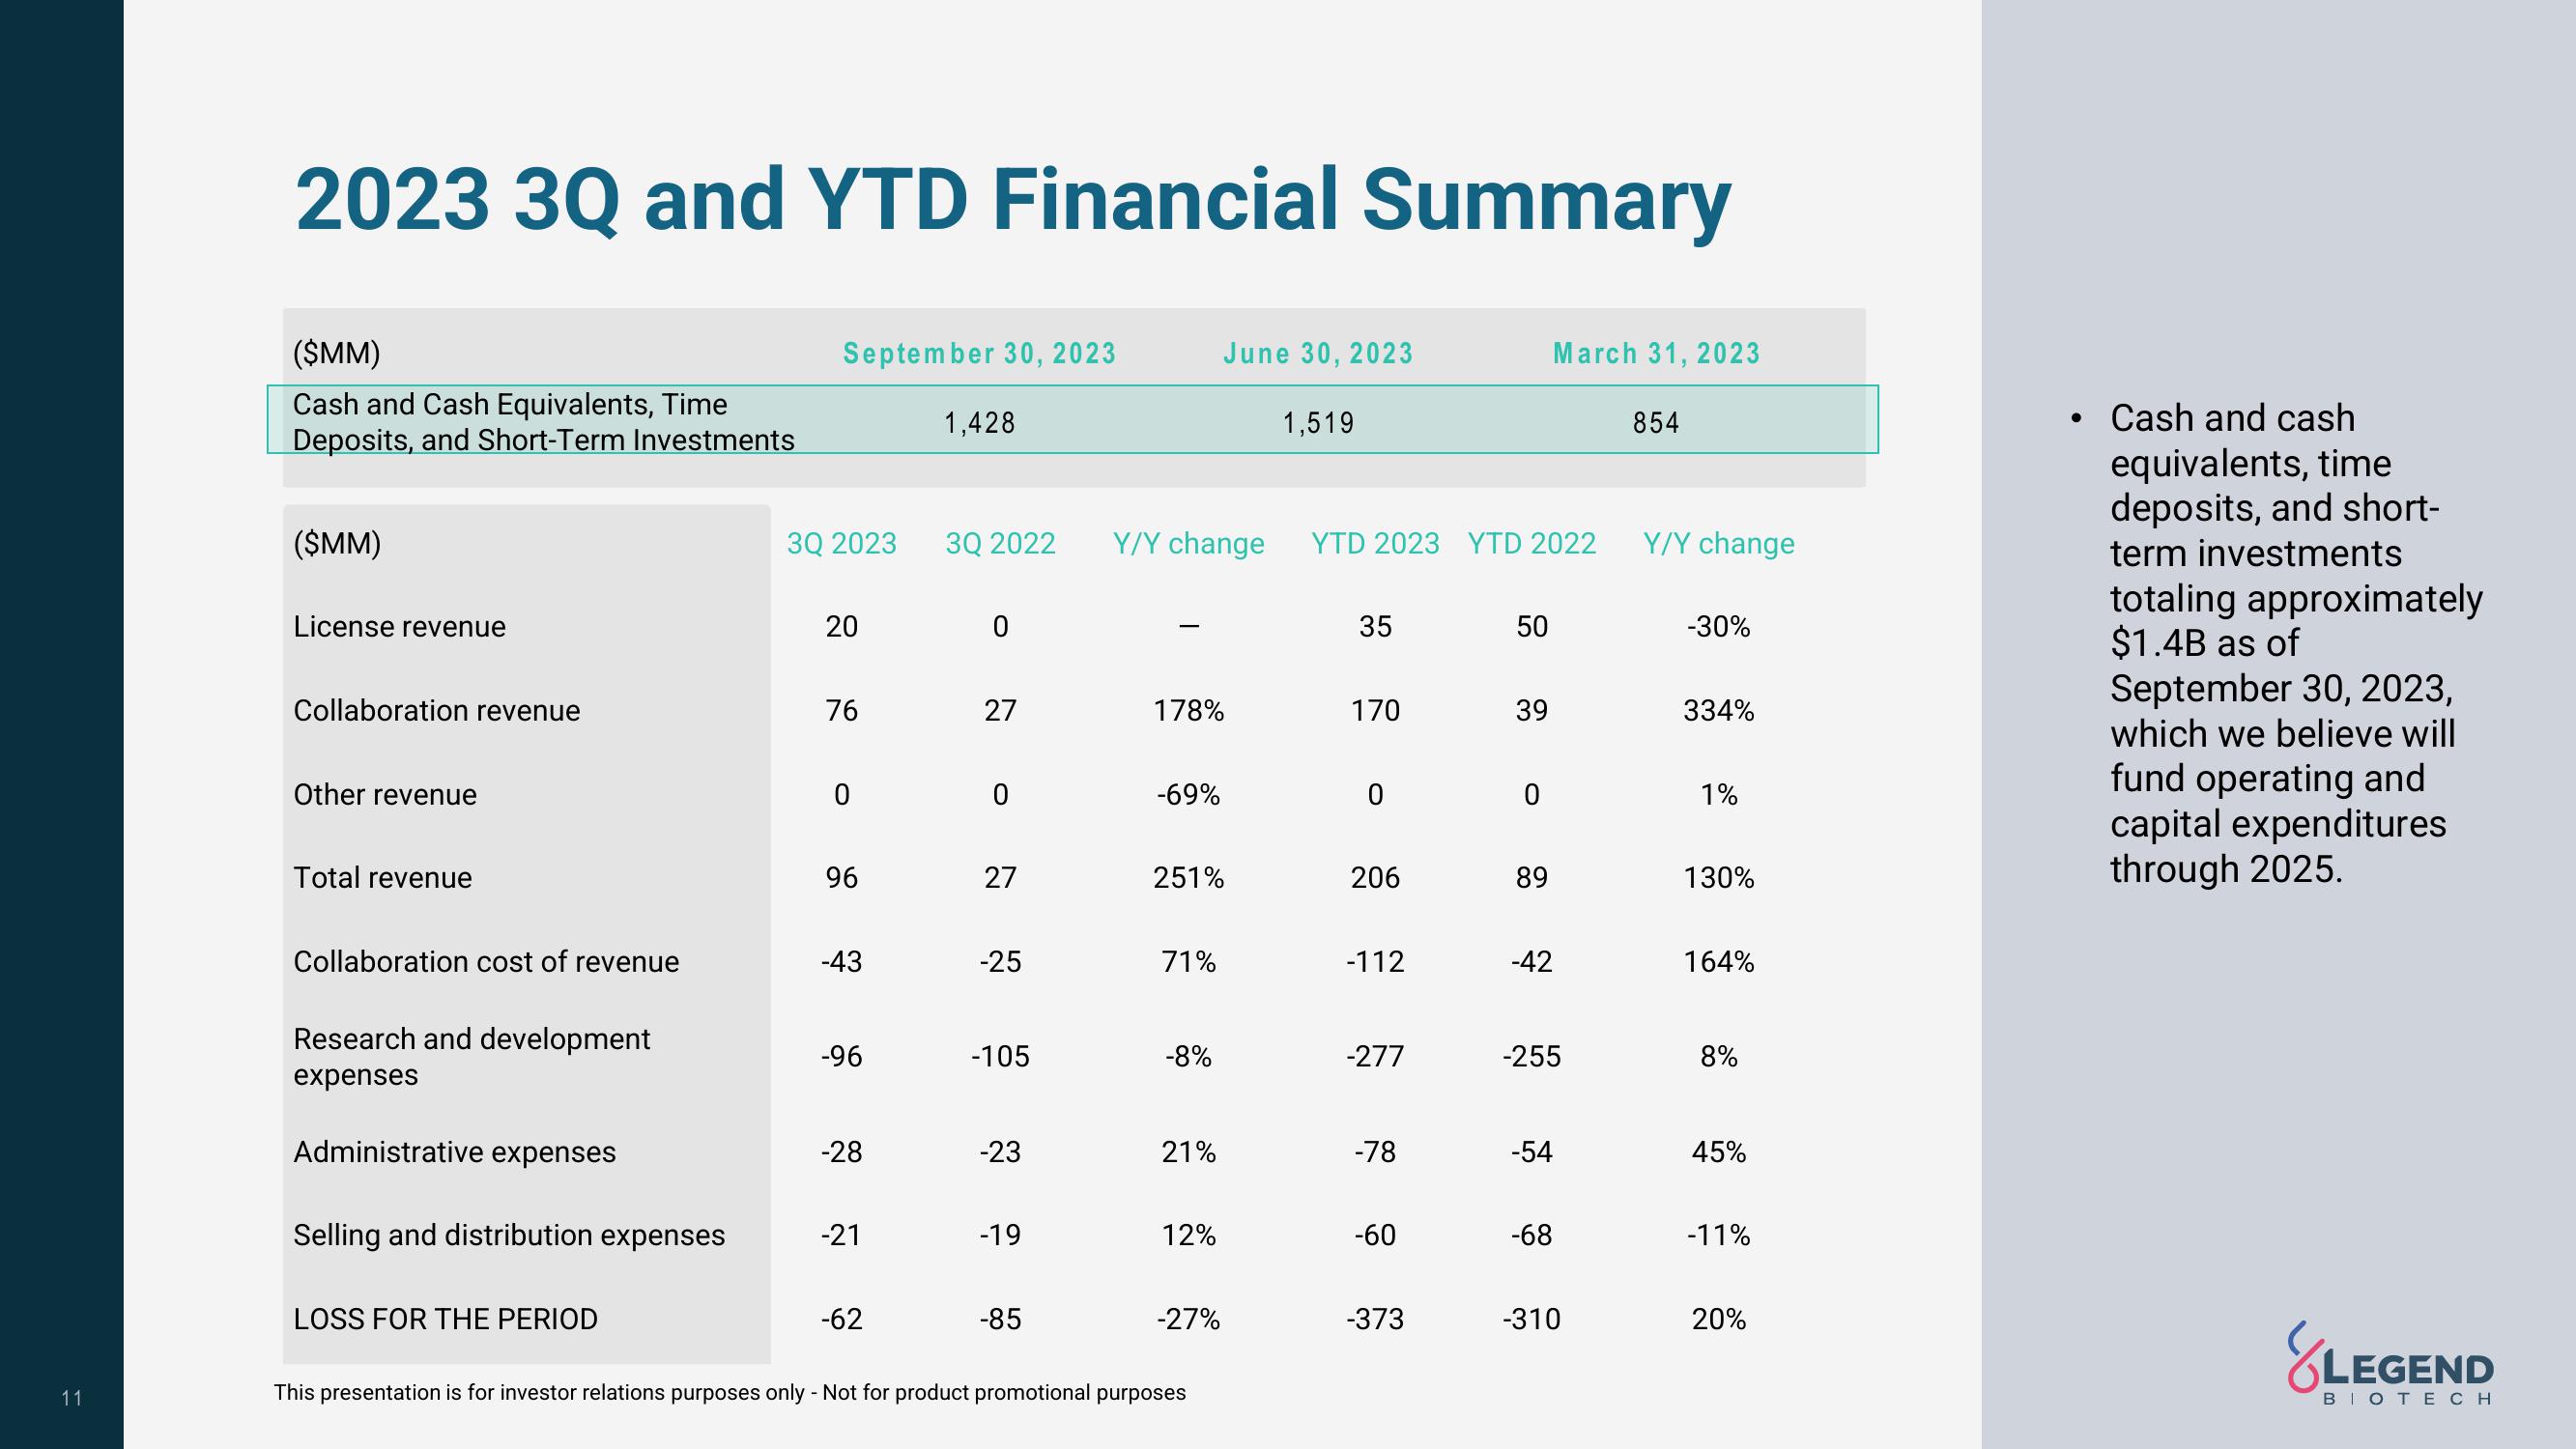
Cash and cash
equivalents, time
deposits, and short-
term investments
totaling approximately
$1.4B as of
September 30, 2023,
which we believe will
fund operating and
capital expenditures
through 2025.
LEGEND
BIOTECHView entire presentation