Marti Investor Presentation Deck
5. Strong unit economics
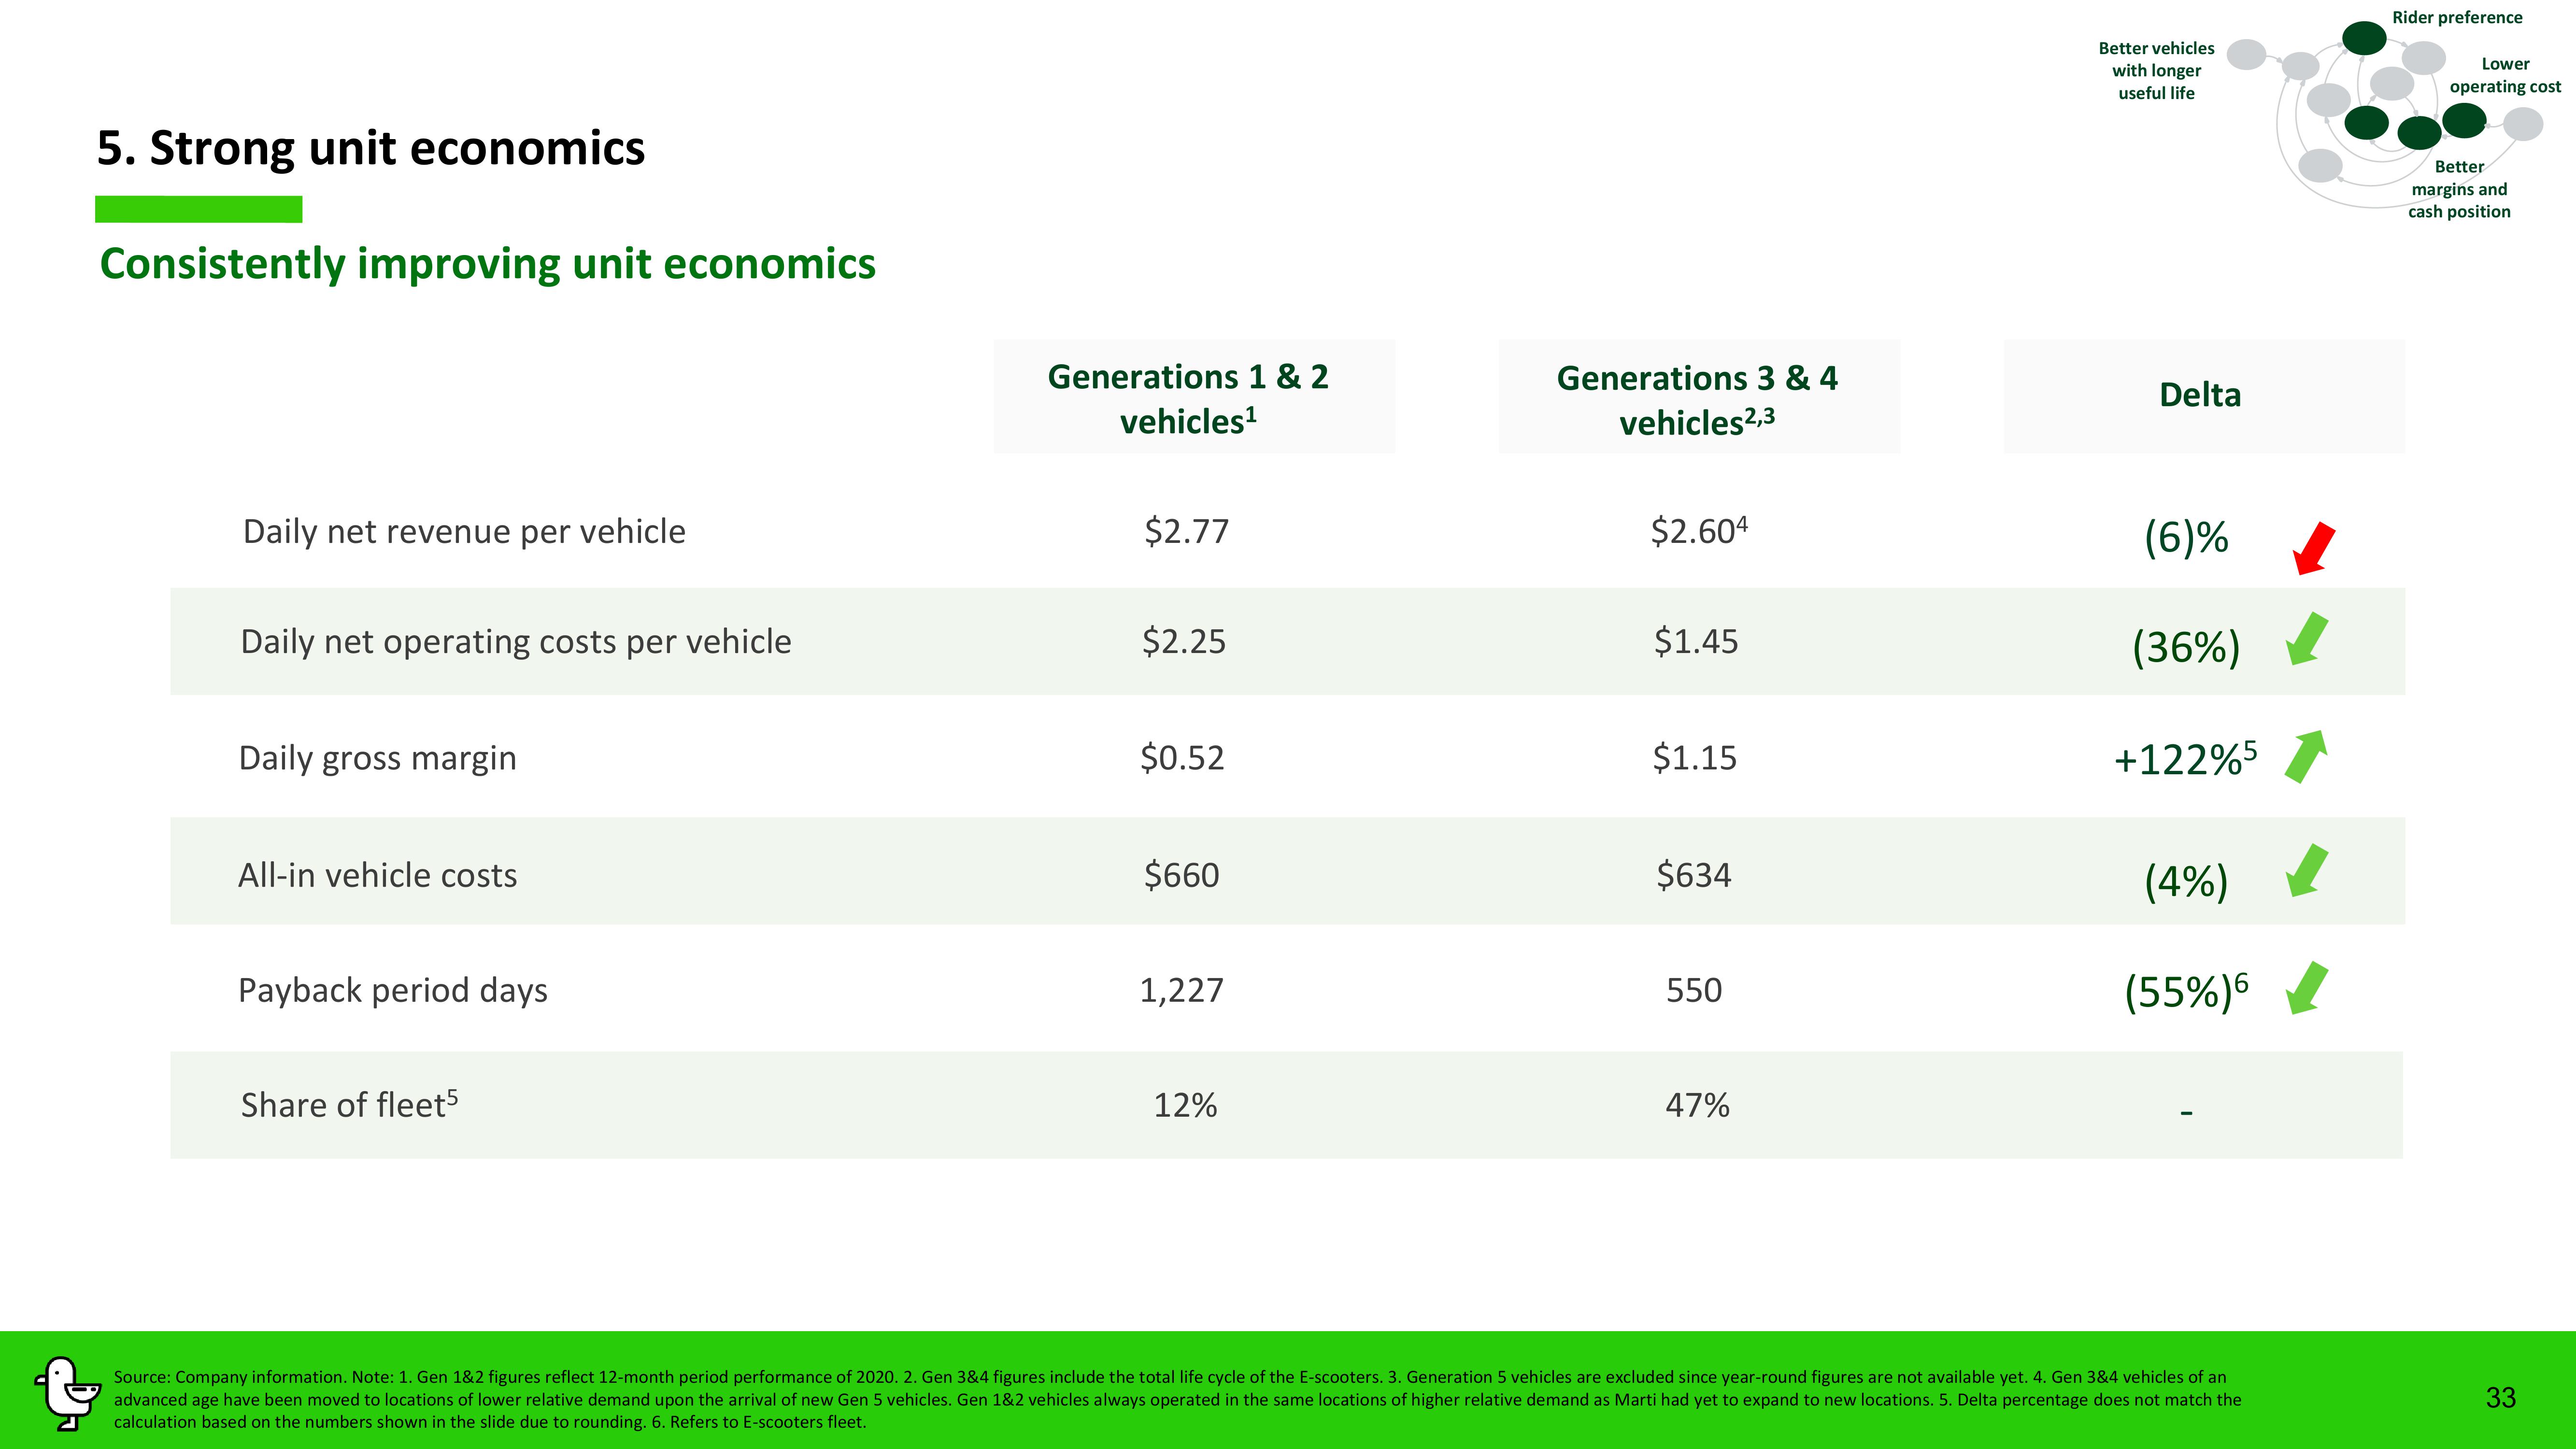
Consistently improving unit economics
Daily net revenue per vehicle
Daily net operating costs per vehicle
Daily gross margin
All-in vehicle costs
Payback period days
Share of fleet5
Generations 1 & 2
vehicles¹
$2.77
$2.25
$0.52
$660
1,227
12%
Generations 3 & 4
vehicles 2,3
$2.604
$1.45
$1.15
$634
550
47%
Better vehicles
with longer
useful life
Delta
(6)%
(36%)
+122%5
(4%)
(55%)6
Source: Company information. Note: 1. Gen 1&2 figures reflect 12-month period performance of 2020. 2. Gen 3&4 figures include the total life cycle of the E-scooters. 3. Generation 5 vehicles are excluded since year-round figures are not available yet. 4. Gen 3&4 vehicles of an
advanced age have been moved to locations of lower relative demand upon the arrival of new Gen 5 vehicles. Gen 1&2 vehicles always operated in the same locations of higher relative demand as Marti had yet to expand to new locations. 5. Delta percentage does not match the
calculation based on the numbers shown in the slide due to rounding. 6. Refers to E-scooters fleet.
Rider preference
Lower
operating cost
Better
margins and
cash position
33View entire presentation