LanzaTech SPAC Presentation Deck
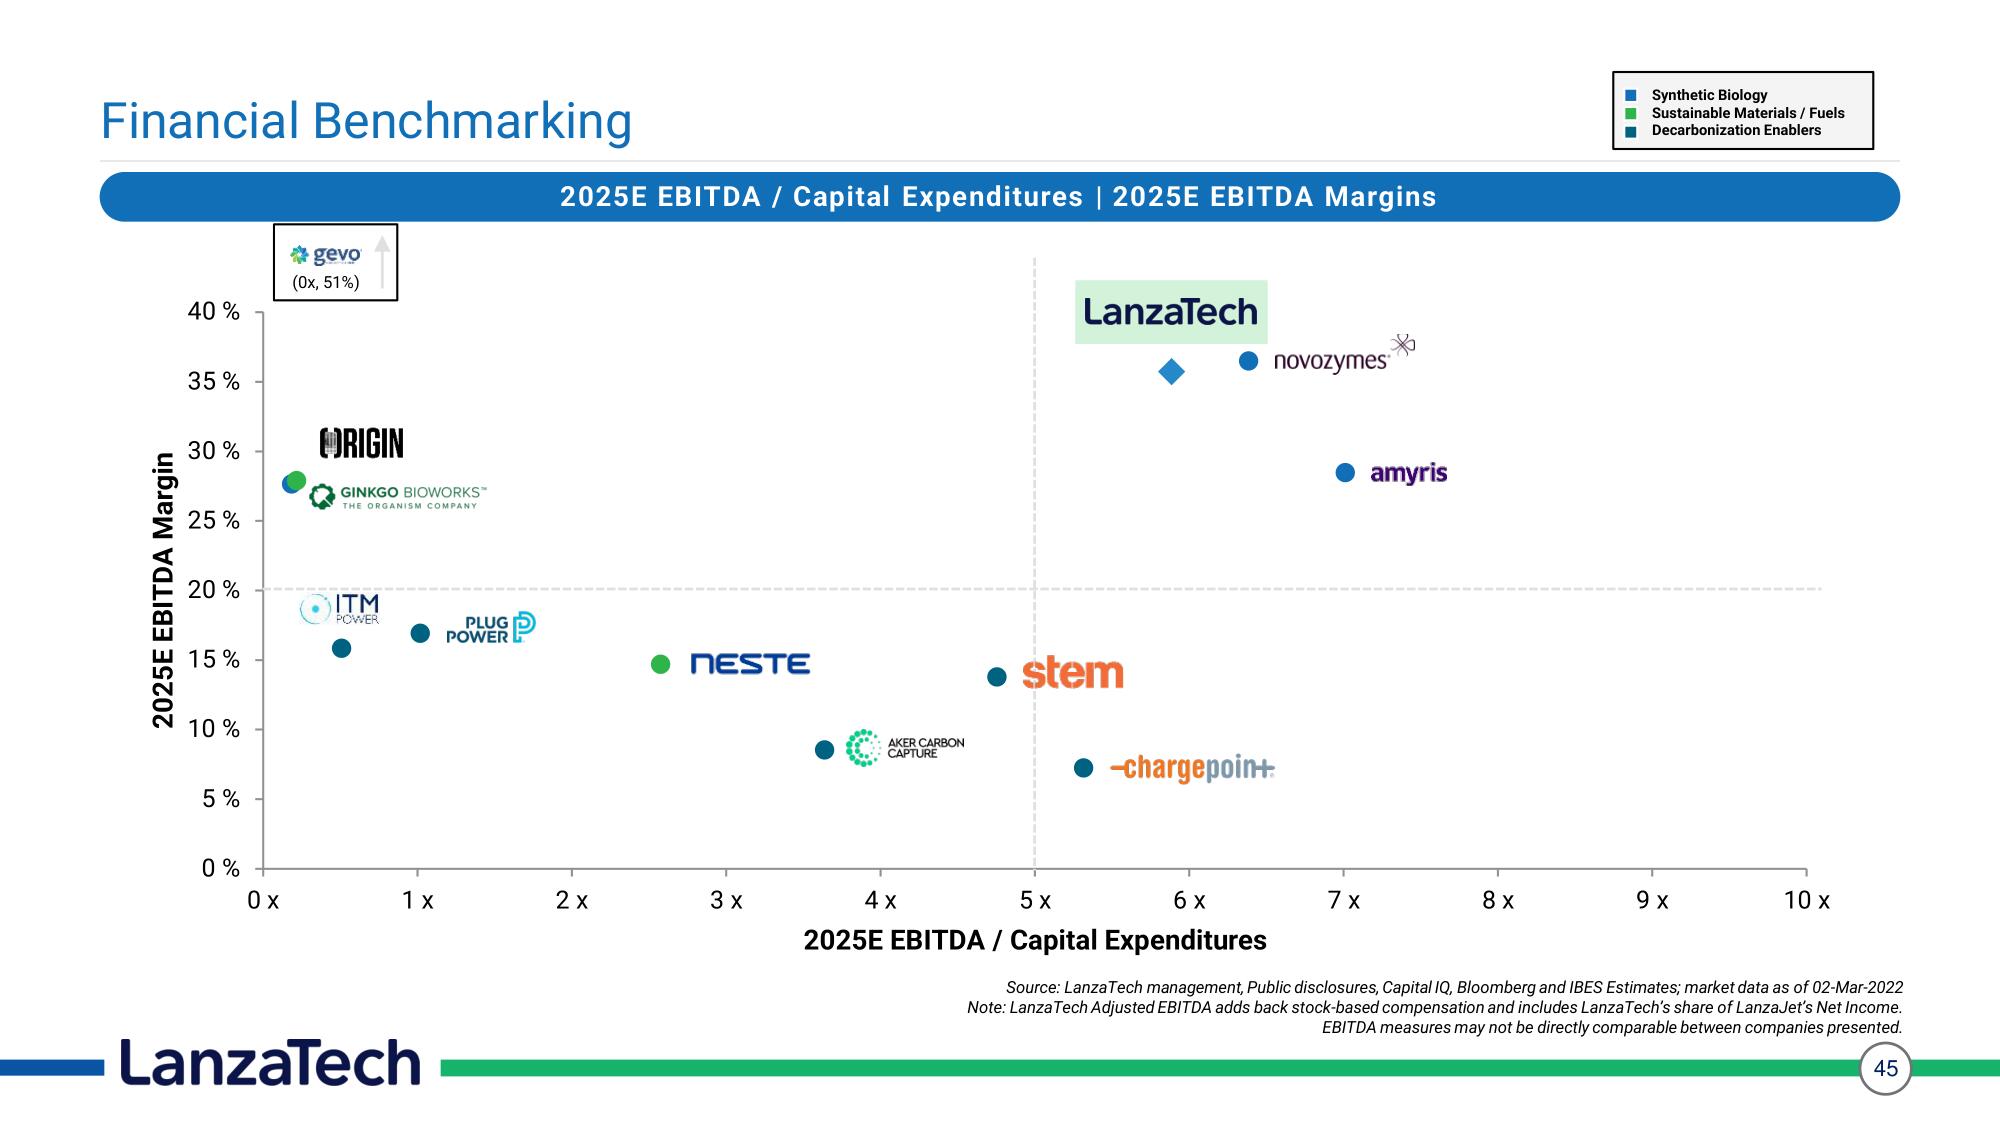
Financial Benchmarking
2025E EBITDA Margin
40 %
35%
30%
25%
20%
15%
10%
5%
0%
Ox
gevo
(0x, 51%)
ORIGIN
GINKGO BIOWORKS™
THE ORGANISM COMPANY
ITM
POWER
1 x
LanzaTech
PLUG
POWER
2025E EBITDA / Capital Expenditures | 2025E EBITDA Margins
2x
NESTE
3 x
AKER CARBON
CAPTURE
LanzaTech
● stem
-chargepoin+
4 x
5 x
6 x
2025E EBITDA / Capital Expenditures
novozymes
7x
amyris
8 x
Synthetic Biology
Sustainable Materials / Fuels
Decarbonization Enablers
9 x
10 x
Source: LanzaTech management, Public disclosures, Capital IQ, Bloomberg and IBES Estimates; market data as of 02-Mar-2022
Note: LanzaTech Adjusted EBITDA adds back stock-based compensation and includes LanzaTech's share of LanzaJet's Net Income.
EBITDA measures may not be directly comparable between companies presented.
45View entire presentation