Bill.com Investor Presentation Deck
BILL at a glance
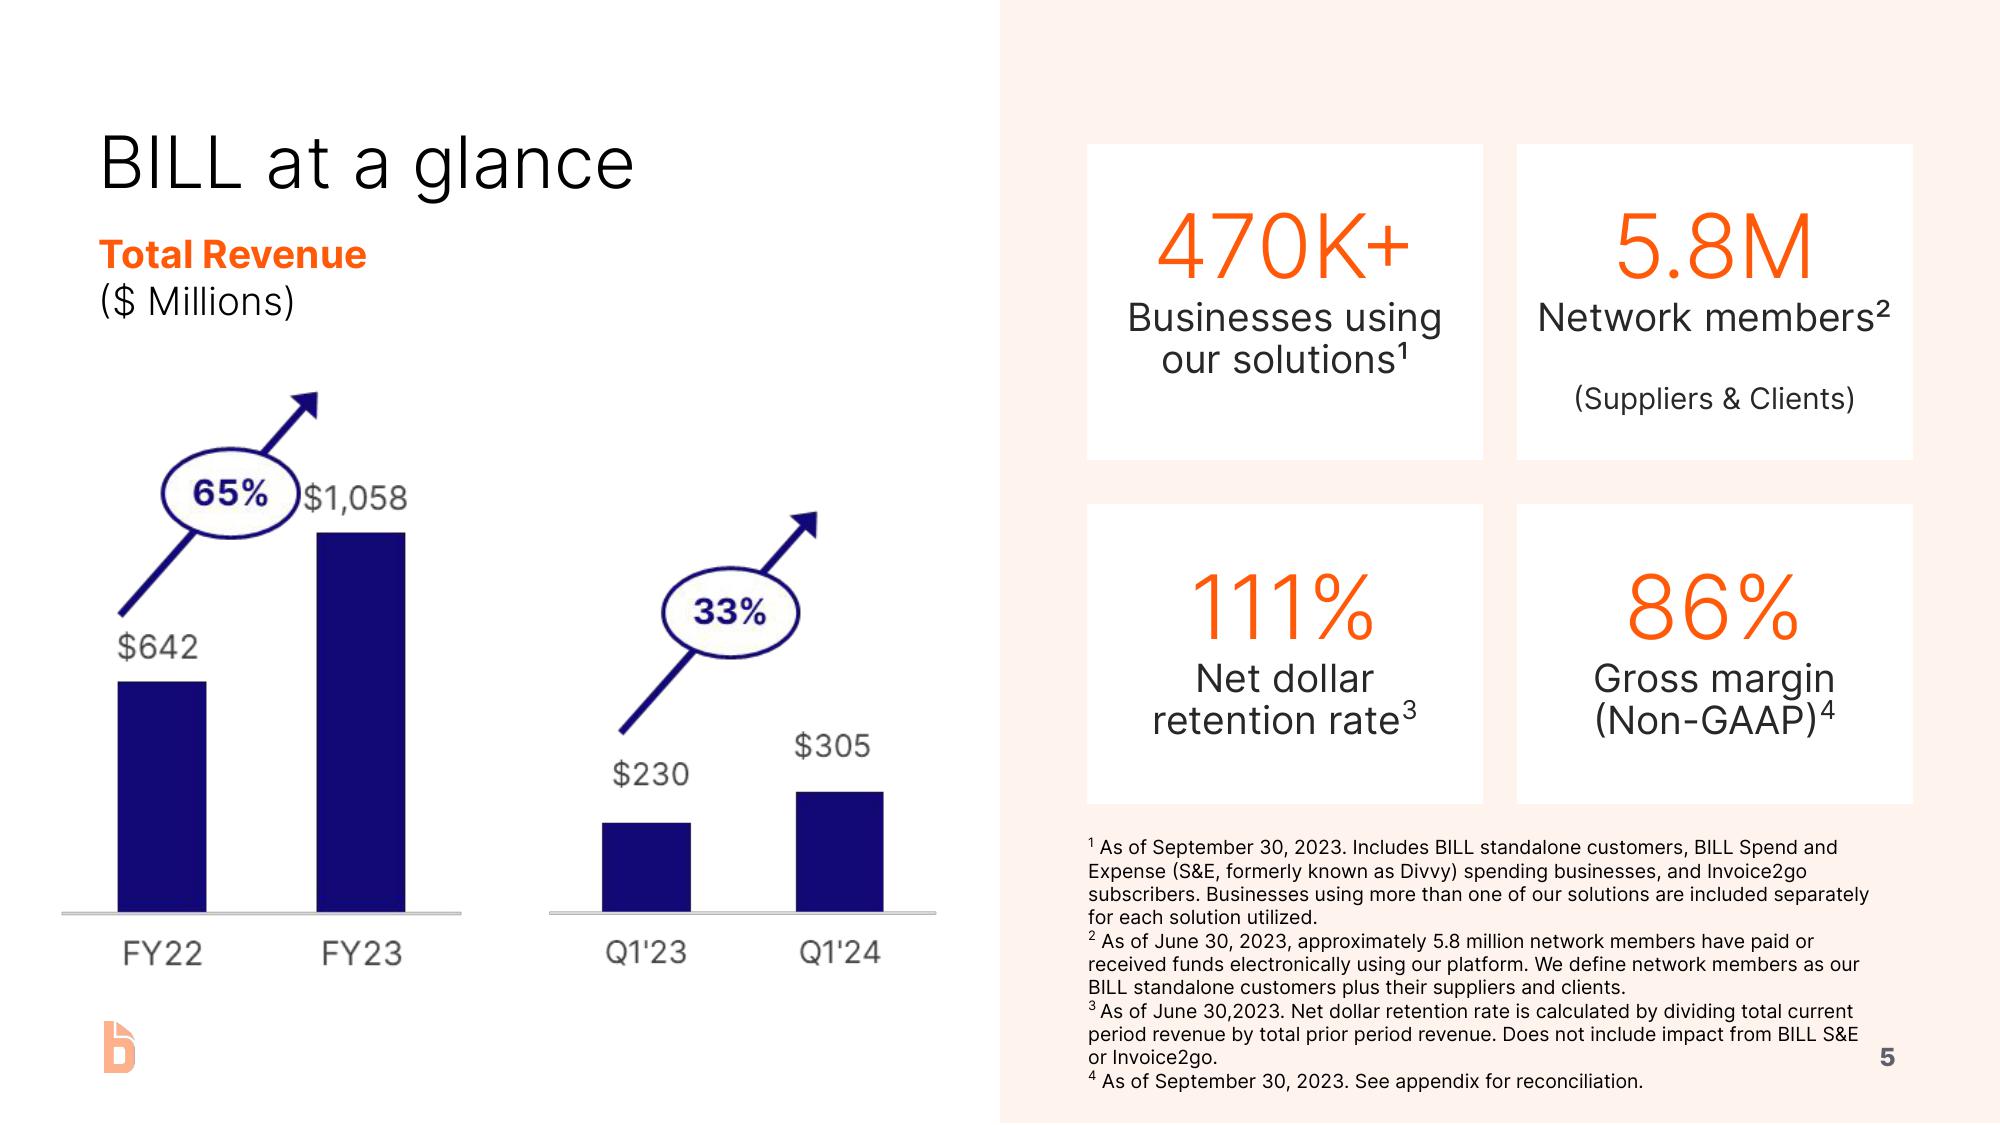
Total Revenue
($ Millions)
65% $1,058
$642
FY22
FY23
33%
$230
Q1¹23
$305
Q1¹24
470K+
Businesses using
our solutions¹
111%
Net dollar
retention rate³
5.8M
Network members²
(Suppliers & Clients)
86%
Gross margin
(Non-GAAP)4
¹ As of September 30, 2023. Includes BILL standalone customers, BILL Spend and
Expense (S&E, formerly known as Divvy) spending businesses, and Invoice2go
subscribers. Businesses using more than one of our solutions are included separately
for each solution utilized.
2 As of June 30, 2023, approximately 5.8 million network members have paid or
received funds electronically using our platform. We define network members as our
BILL standalone customers plus their suppliers and clients.
3 As of June 30,2023. Net dollar retention rate is calculated by dividing total current
period revenue by total prior period revenue. Does not include impact from BILL S&E
or Invoice2go.
5
4 As of September 30, 2023. See appendix for reconciliation.View entire presentation