Kinnevik Results Presentation Deck
WE SEEK TO BE SYSTEMATIC IN CONSTRUING PEER SETS FOR OUR
UNLISTED INVESTMENTS, AND RESTRAINED IN AMENDING THEM
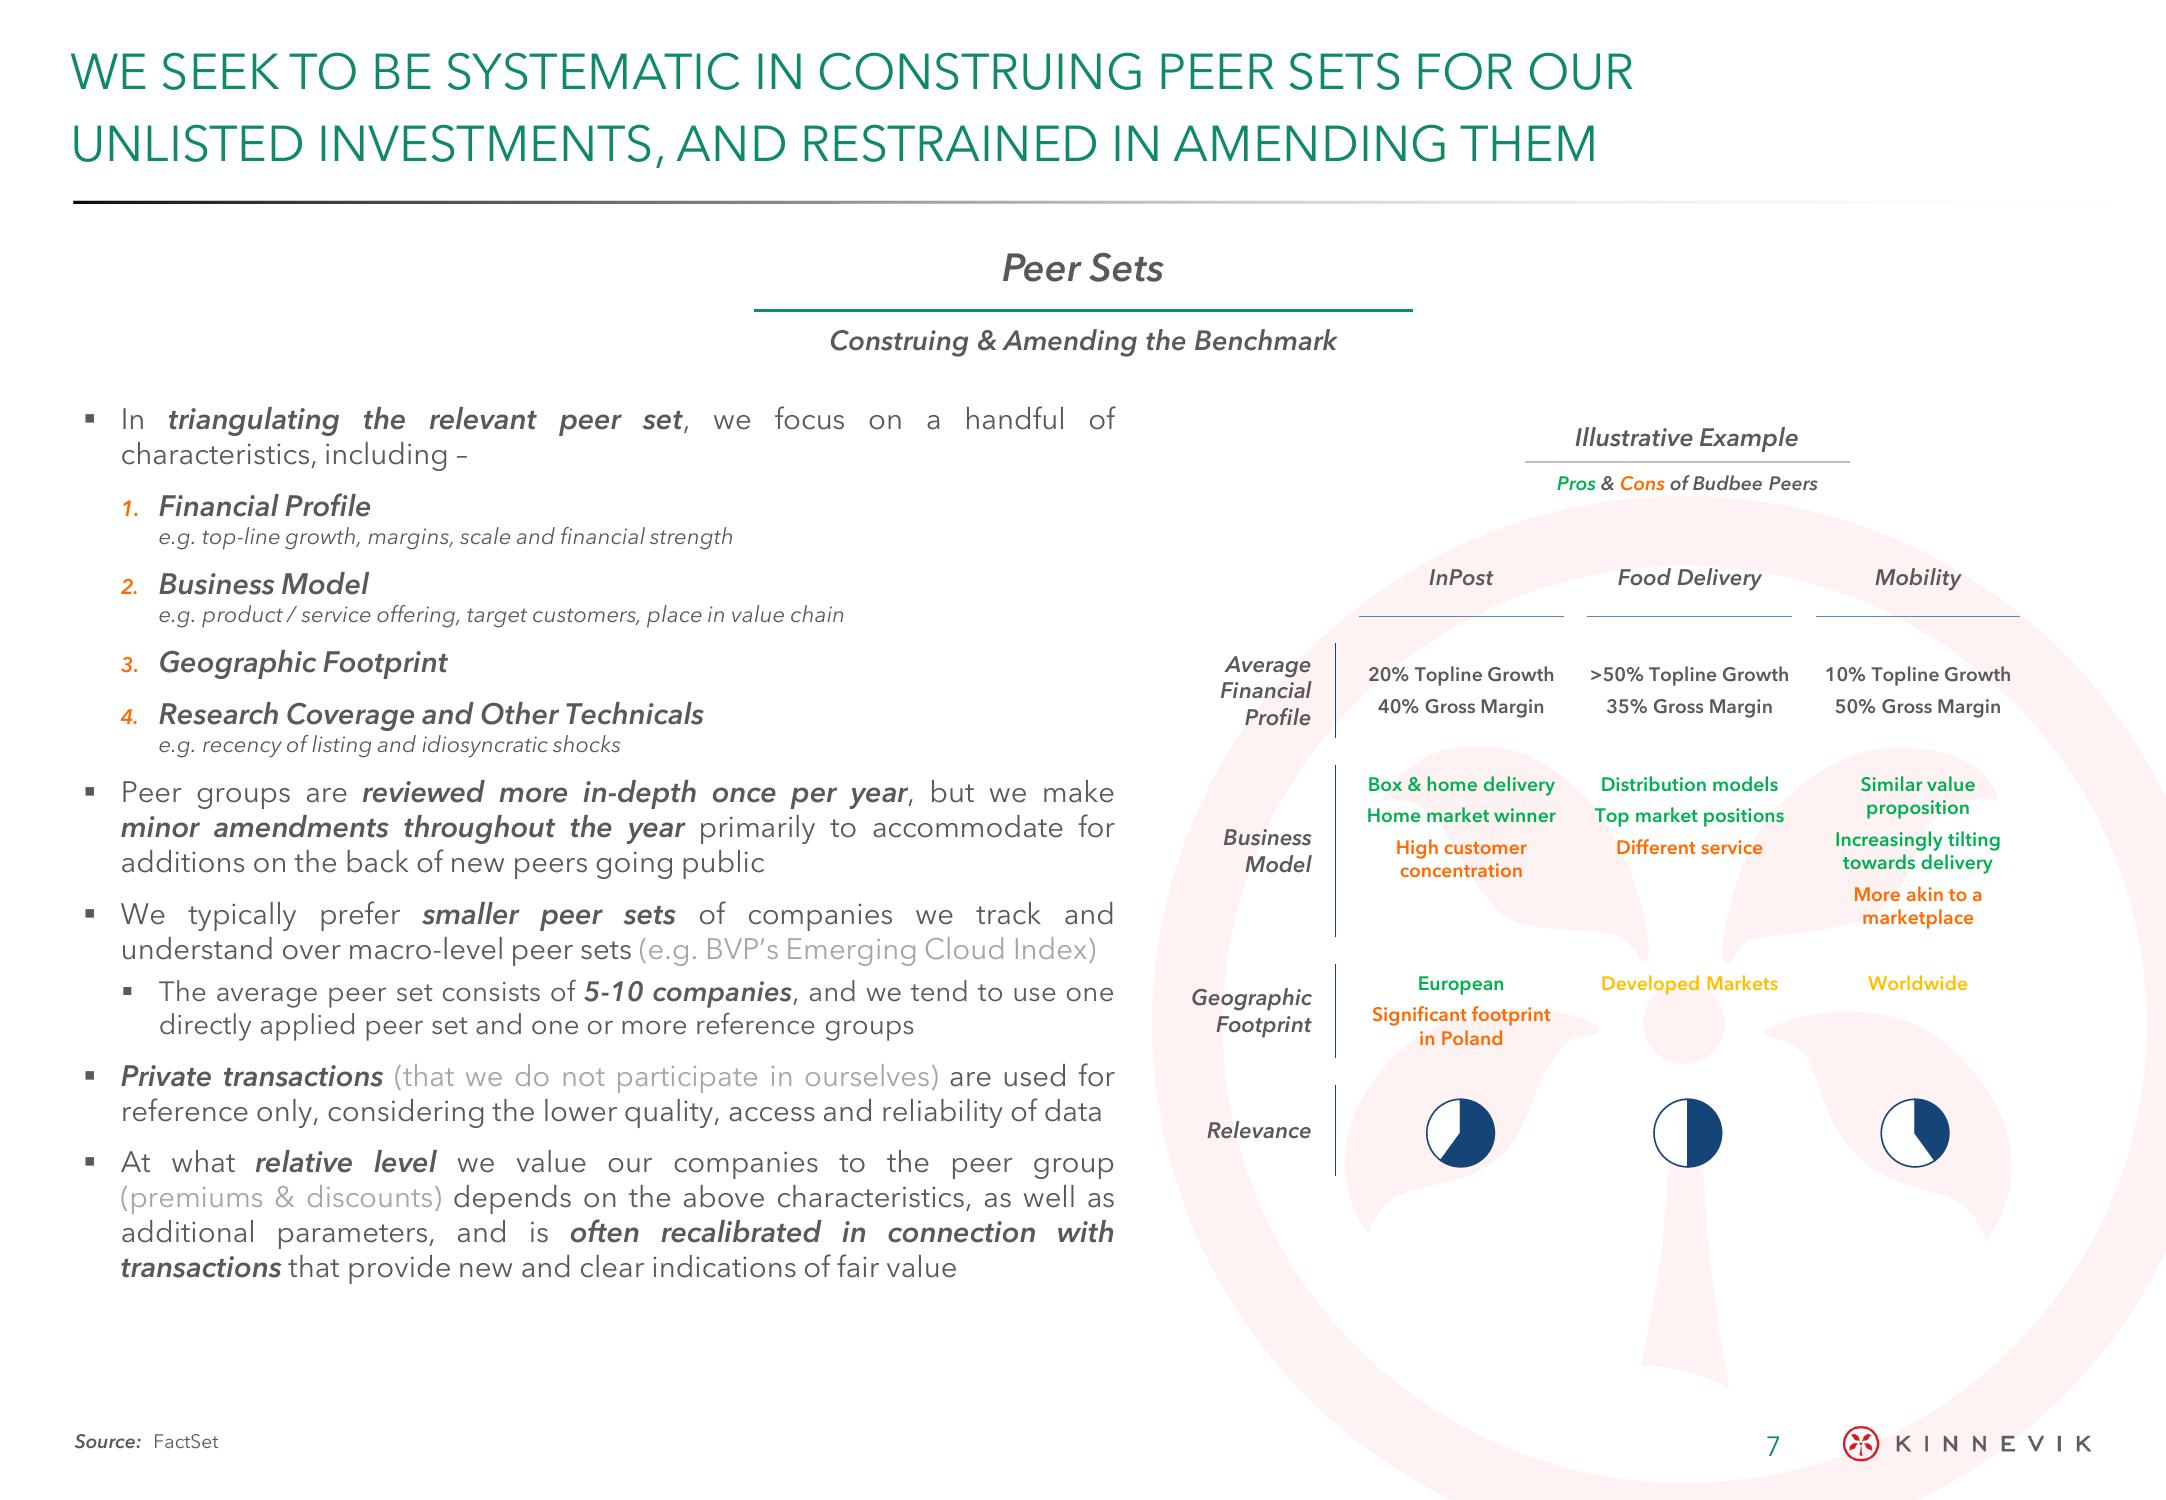
▪ In triangulating the relevant peer set, we focus on a handful of
characteristics, including -
I
1. Financial Profile
e.g. top-line growth, margins, scale and financial strength
2. Business Model
I
Peer Sets
Construing & Amending the Benchmark
e.g.product/service offering, target customers, place in value chain
3. Geographic Footprint
4. Research Coverage and Other Technicals
e.g. recency of listing and idiosyncratic shocks
Peer groups are reviewed more in-depth once per year, but we make
minor amendments throughout the year primarily to accommodate for
additions on the back of new peers going public
▪ We typically prefer smaller peer sets of companies we track and
understand over macro-level peer sets (e.g. BVP's Emerging Cloud Index)
■
The average peer set consists of 5-10 companies, and we tend to use one
directly applied peer set and one or more reference groups
Private transactions (that we do not participate in ourselves) are used for
reference only, considering the lower quality, access and reliability of data
▪ At what relative level we value our companies to the peer group
(premiums & discounts) depends on the above characteristics, as well as
additional parameters, and is often recalibrated in connection with
transactions that provide new and clear indications of fair value
Source: FactSet
Average
Financial
Profile
Business
Model
Geographic
Footprint
Relevance
InPost
20% Topline Growth
40% Gross Margin
Box & home delivery
Home market winner
High customer
concentration
European
Significant footprint
in Poland
Illustrative Example
Pros & Cons of Budbee Peers
Food Delivery
>50% Topline Growth
35% Gross Margin
Distribution models
Top market positions
Different service
Developed Markets
7
Mobility
10% Topline Growth
50% Gross Margin
Similar value
proposition
Increasingly tilting
towards delivery
More akin to a
marketplace
Worldwide
KINNEVIKView entire presentation