Newsight Imaging SPAC
Year ($K)
FINANCIAL PROJECTIONS
Revenues
Cost of Sales
Gross profit $K
Gross profit %
Operating Expenses
R&D
OP
S&M
G&A
Subsidiaries expenses
Total Operating Expenses
EBITDA -Op Profit (loss)
Tax
Net Profit After Tax
2021
(audited)
1,184
649
535
45%
3,403
1,215
1,092
2,326
9,224
(8,689)
Highlights
(8,689)
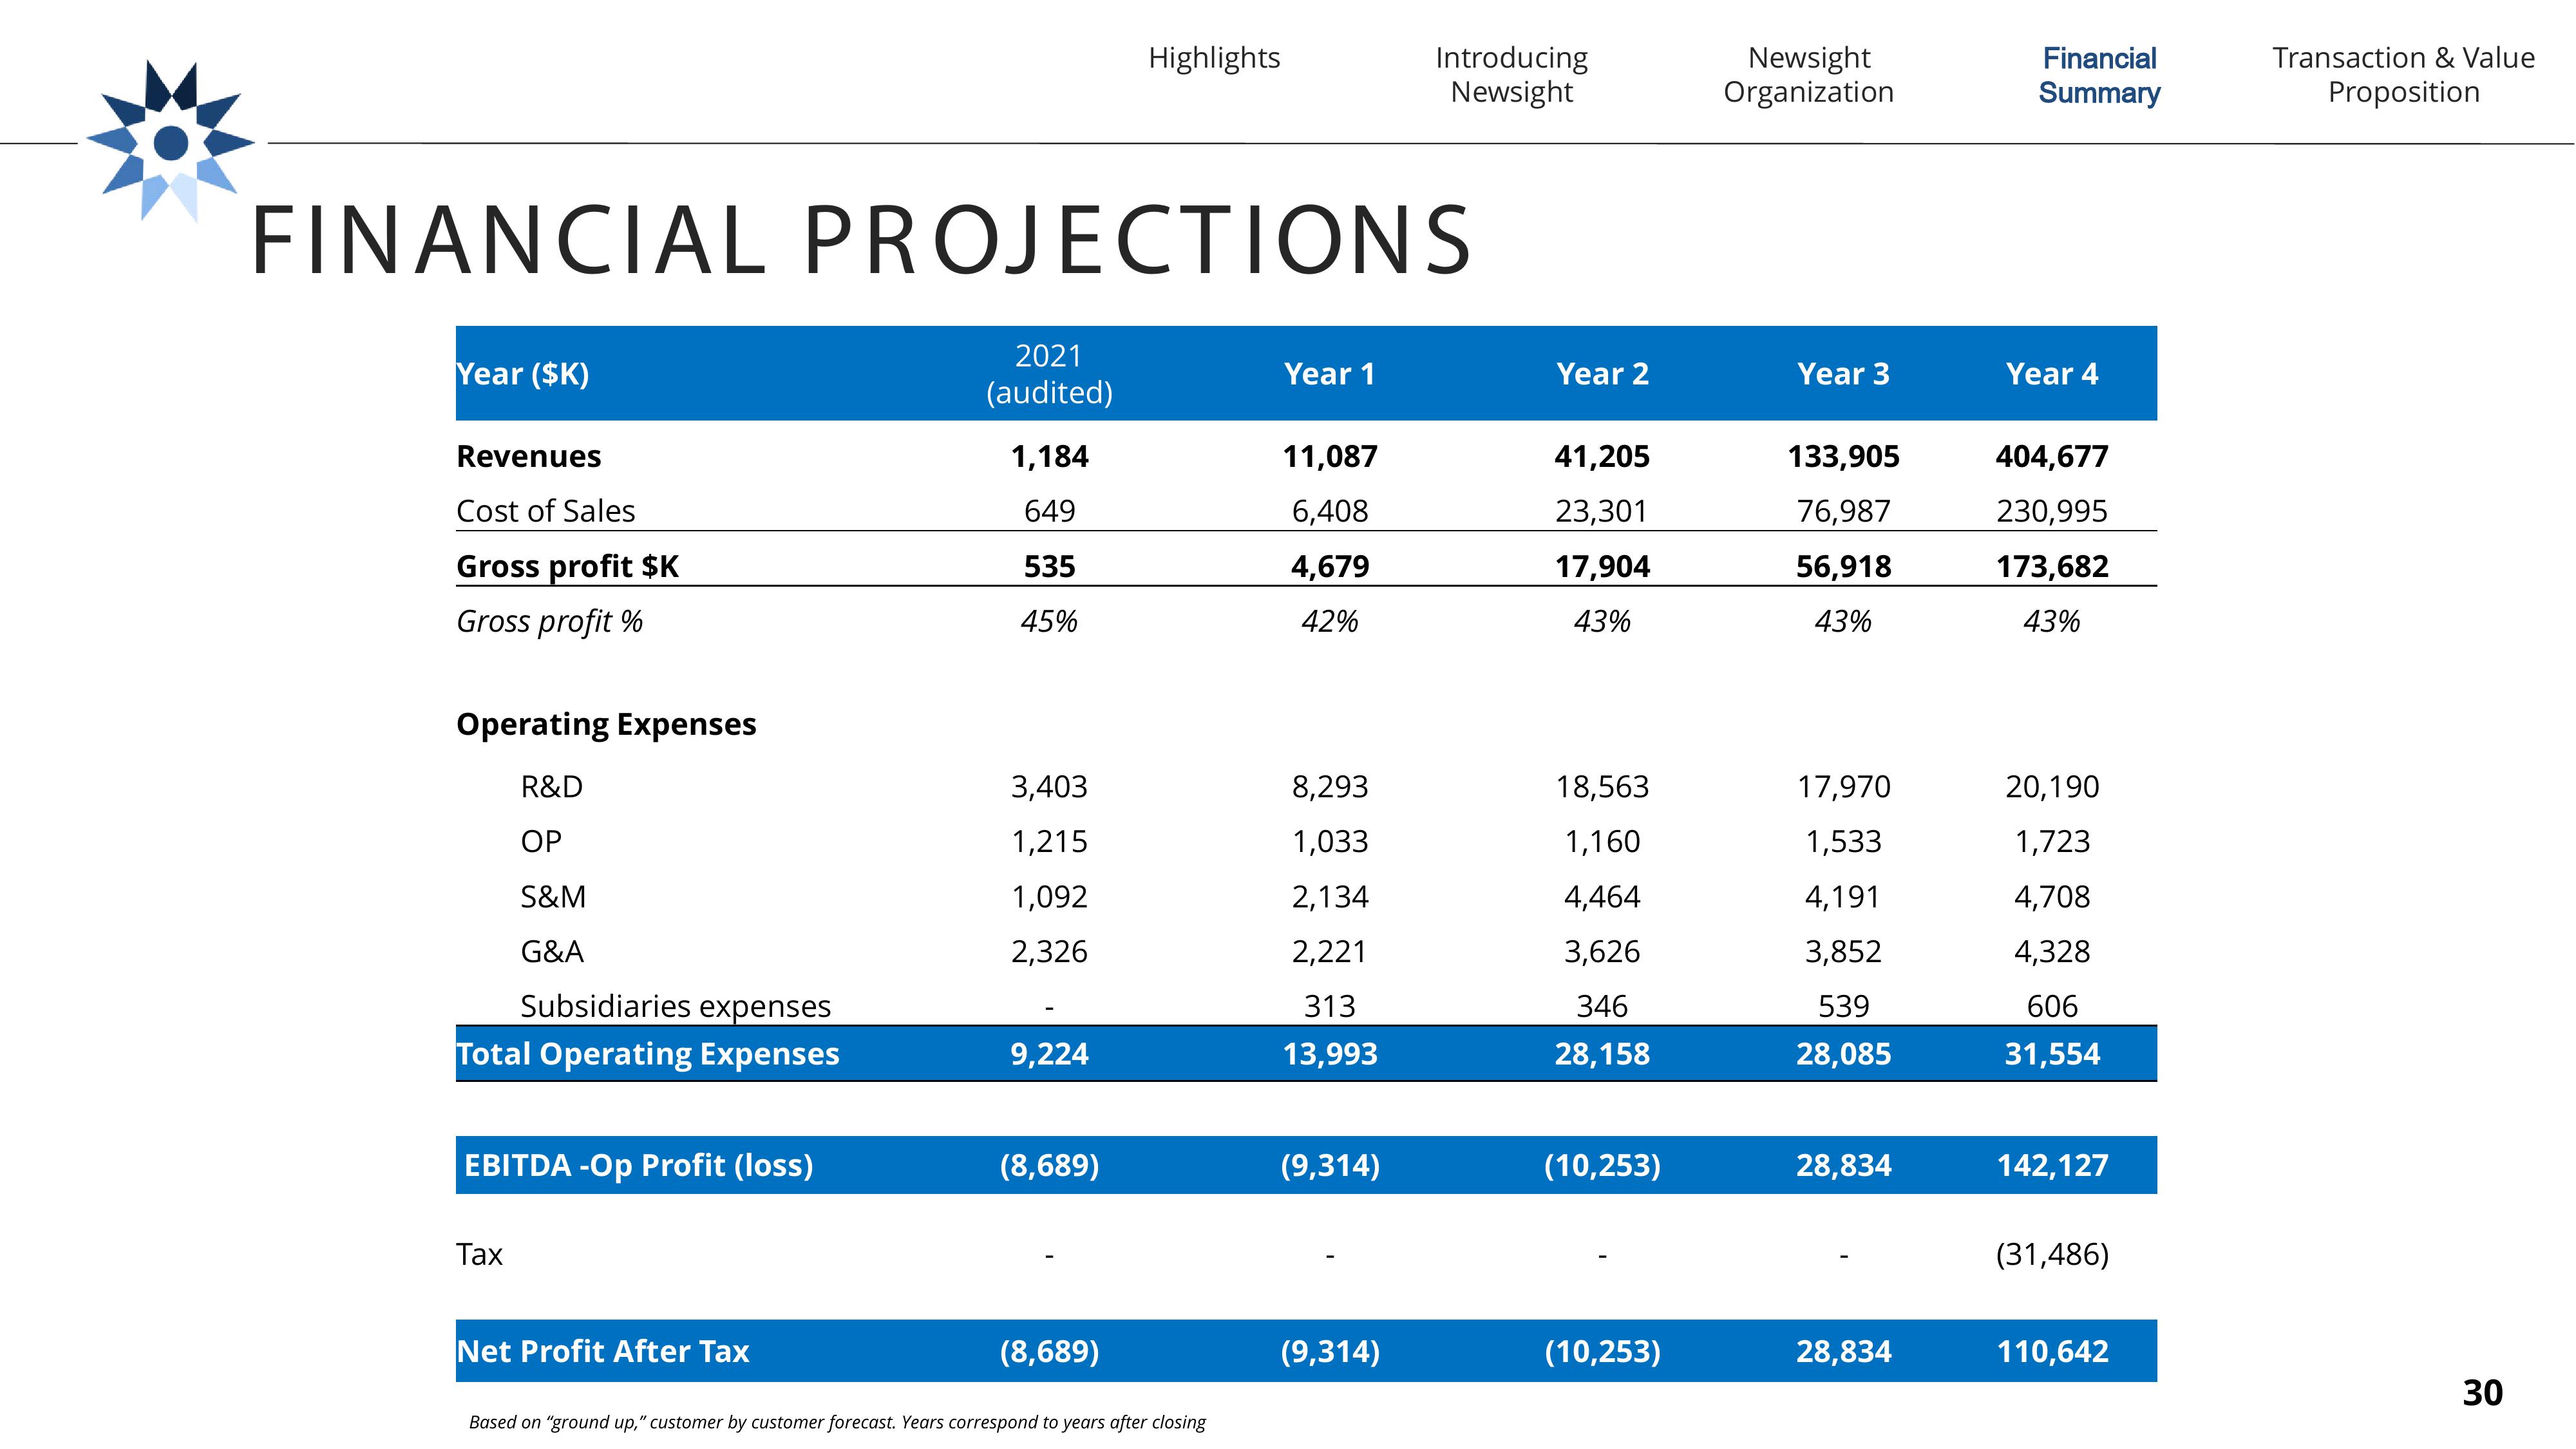
Based on "ground up," customer by customer forecast. Years correspond to years after closing
Year 1
11,087
6,408
4,679
42%
8,293
1,033
2,134
2,221
313
13,993
(9,314)
Introducing
Newsight
(9,314)
Year 2
41,205
23,301
17,904
43%
18,563
1,160
4,464
3,626
346
28,158
(10,253)
(10,253)
Newsight
Organization
Year 3
133,905
76,987
56,918
43%
17,970
1,533
4,191
3,852
539
28,085
28,834
28,834
Financial
Summary
Year 4
404,677
230,995
173,682
43%
20,190
1,723
4,708
4,328
606
31,554
142,127
(31,486)
110,642
Transaction & Value
Proposition
30View entire presentation