CareCloud Results Presentation Deck
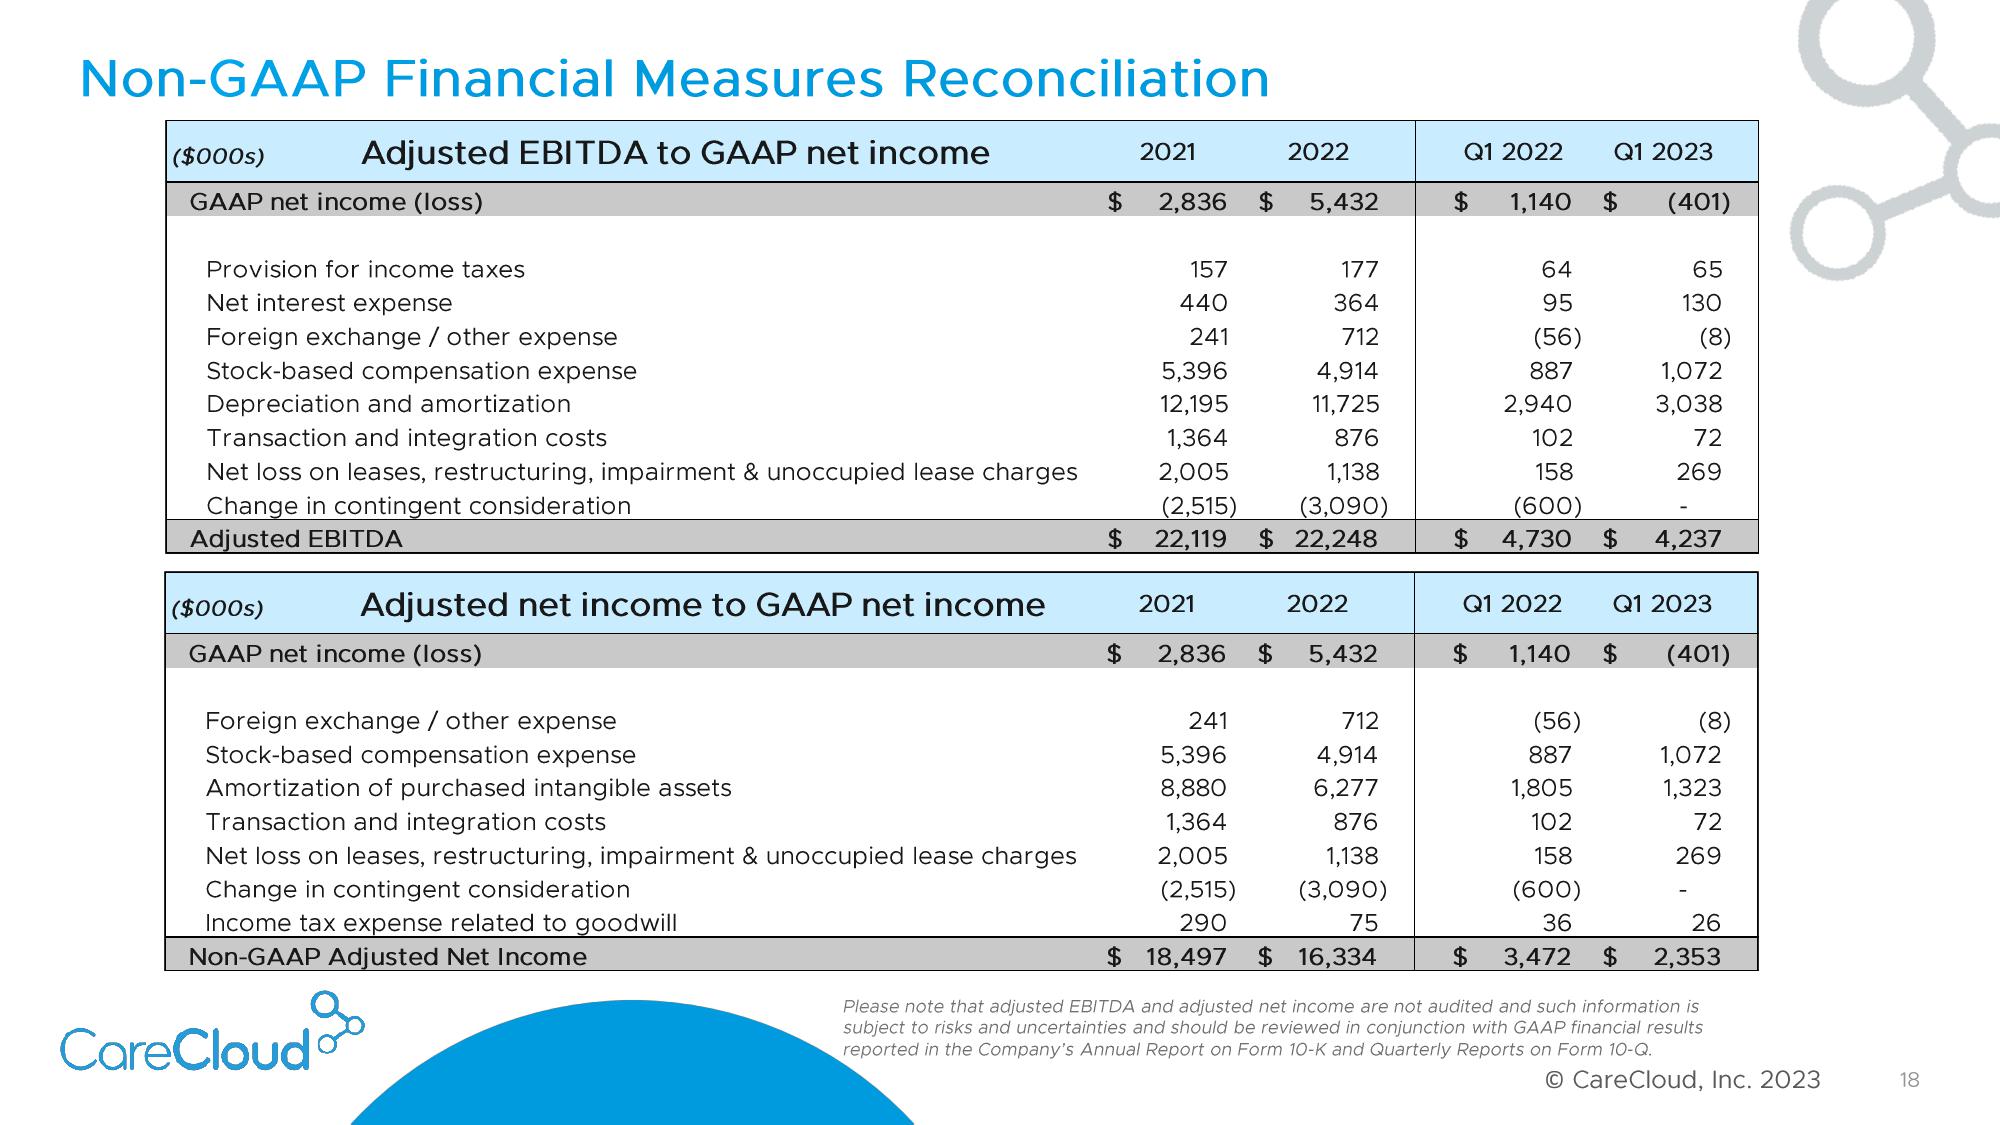
Non-GAAP Financial Measures Reconciliation
Adjusted EBITDA to GAAP net income
($000s)
GAAP net income (loss)
Provision for income taxes
Net interest expense
Foreign exchange / other expense
Stock-based compensation expense
Depreciation and amortization
Transaction and integration costs
Net loss on leases, restructuring, impairment & unoccupied lease charges
Change in contingent consideration
Adjusted EBITDA
($000s)
GAAP net income (loss)
Adjusted net income to GAAP net income
Foreign exchange / other expense
Stock-based compensation expense
Amortization of purchased intangible assets
Transaction and integration costs
Net loss on leases, restructuring, impairment & unoccupied lease charges
Change in contingent consideration
Income tax expense related to goodwill
Non-GAAP Adjusted Net Income
CareCloud
2021
$ 2,836 $ 5,432
157
440
241
5,396
12,195
1,364
2,005
(2,515)
$ 22,119
2021
$ 2,836
2022
177
364
712
4,914
11,725
876
1,138
(3,090)
$ 22,248
2022
$ 5,432
241
5,396
8,880
1,364
2,005
(2,515)
290
$ 18,497 $ 16,334
712
4,914
6,277
876
1,138
(3,090)
75
Q1 2022
$
1,140
64
95
(56)
887
2,940
102
158
(600)
$ 4,730
Q1 2022
$ 1,140
(56)
Q1 2023
$ (401)
65
130
$
(8)
887
1,805
102
158
(600)
36
$ 3,472 $
1,072
3,038
$ 4,237
72
269
Q1 2023
(401)
(8)
1,072
1,323
72
269
26
2,353
Please note that adjusted EBITDA and adjusted net income are not audited and such information is
subject to risks and uncertainties and should be reviewed in conjunction with GAAP financial results
reported in the Company's Annual Report on Form 10-K and Quarterly Reports on Form 10-Q.
O CareCloud, Inc. 2023
18View entire presentation