Volta SPAC Presentation Deck
Long-Term Financial Projections Summary
volta
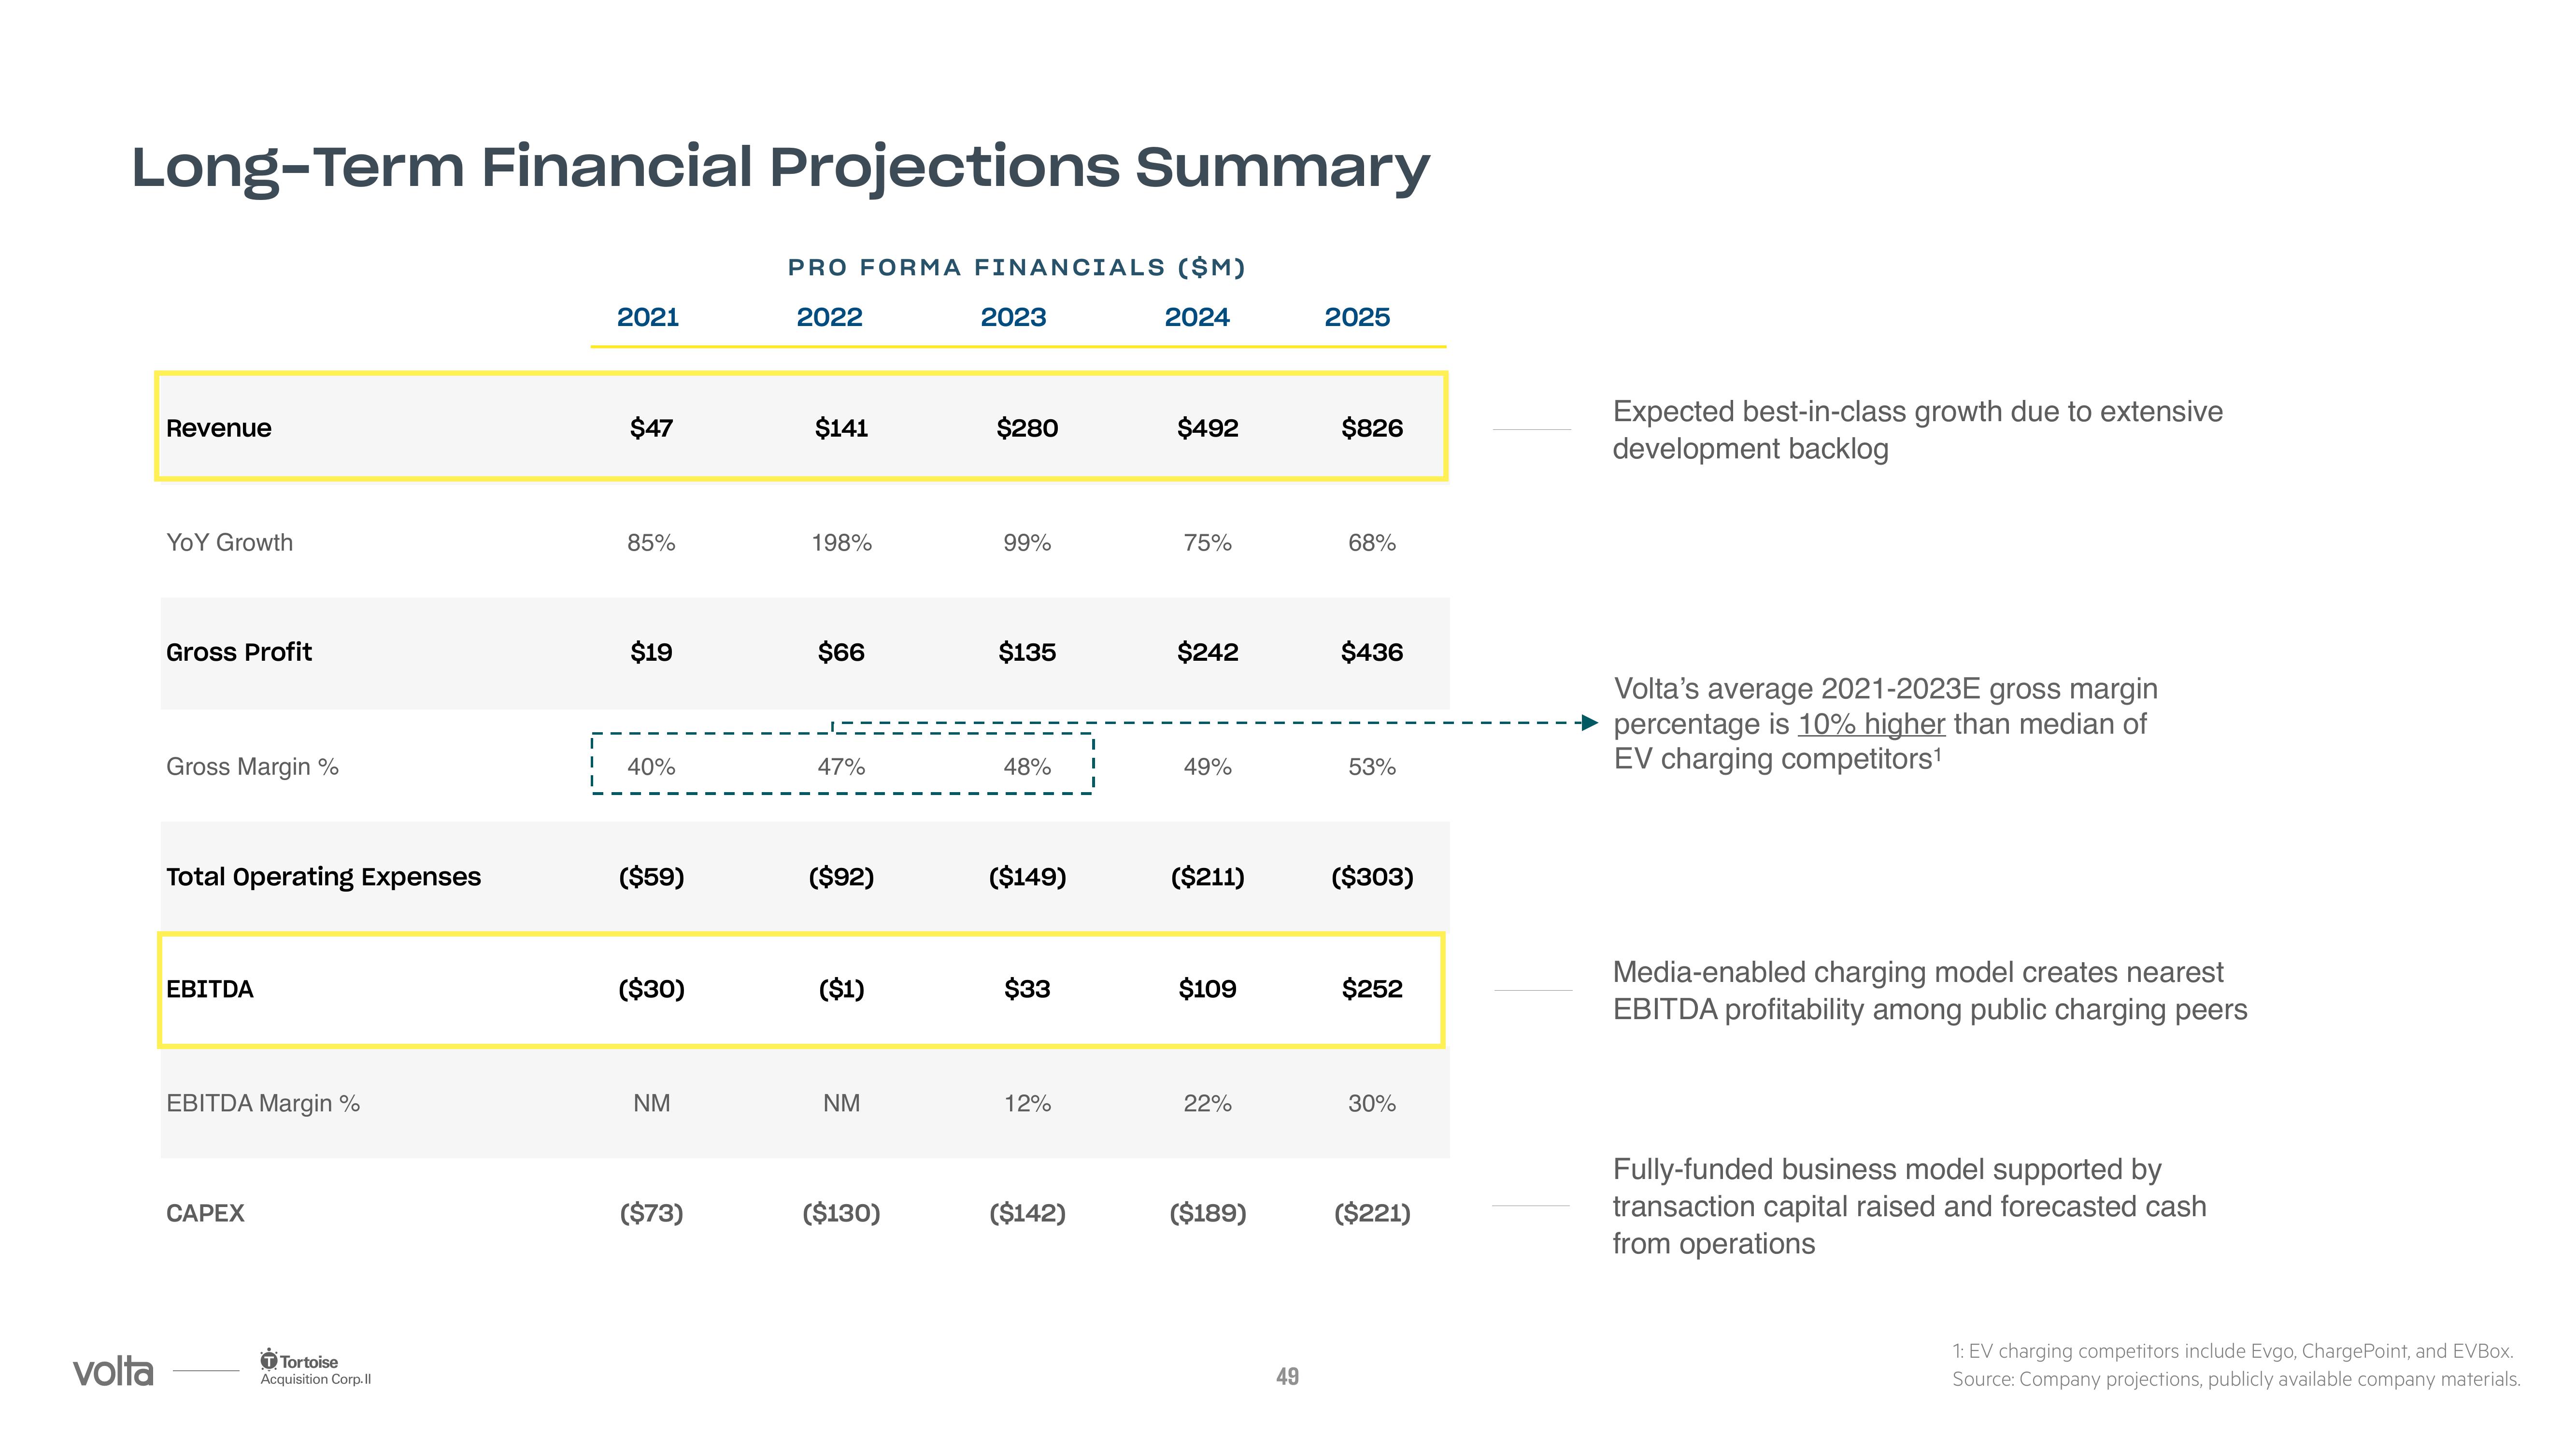
Revenue
YOY Growth
Gross Profit
Gross Margin %
Total Operating Expenses
EBITDA
EBITDA Margin %
CAPEX
Tortoise
Acquisition Corp.Il
2021
$47
85%
$19
40%
($59)
($30)
NM
($73)
PRO FORMA FINANCIALS ($M)
2022
2024
$141
198%
$66
47%
($92)
($1)
NM
($130)
2023
$280
99%
$135
48%
($149)
$33
12%
($142)
$492
75%
$242
49%
($211)
$109
22%
($189)
49
2025
$826
68%
$436
53%
($303)
$252
30%
($221)
Expected best-in-class growth due to extensive
development backlog
Volta's average 2021-2023E gross margin
percentage is 10% higher than median of
EV charging competitors¹
Media-enabled charging model creates nearest
EBITDA profitability among public charging peers
Fully-funded business model supported by
transaction capital raised and forecasted cash
from operations
1: EV charging competitors include Evgo, ChargePoint, and EVBox.
Source: Company projections, publicly available company materials.View entire presentation