Flutter Investor Day Presentation Deck
US
Pro forma £m
Average monthly players ('000s)
Sportsbook stakes
Sportsbook net revenue margin
Sports revenue
Gaming revenue
Total revenue
Cost of sales
Cost of sales as a % of net revenue
Gross profit
Sales & marketing costs
Contribution
Other operating costs
Adjusted EBITDA
Adjusted EBITDA margin
Depreciation and amortisation
Adjusted operating profit
Flutter
H1 2021
1,470
5,072
6.2%
452
200
652
(293)
44.9%
359
(292)
67
(154)
(87)
(13.3%)
(22)
(108)
H1 2020
552
1,090
4.9%
164
113
278
(116)
41.9%
162
(88)
73
(93)
(19)
(6.9%)
(18)
(38)
YOY
+166%
+365%
+130bps
+175%
+76%
+135%
+152%
+300bps
+122%
+230%
-8%
+66%
+348%
-630bps
+20%
+189%
YOY CC
+402%
+130bps
+202%
+95%
+159%
+177%
+300bps
+145%
+262%
+2%
+83%
+376%
-610bps
+33%
+213%
●
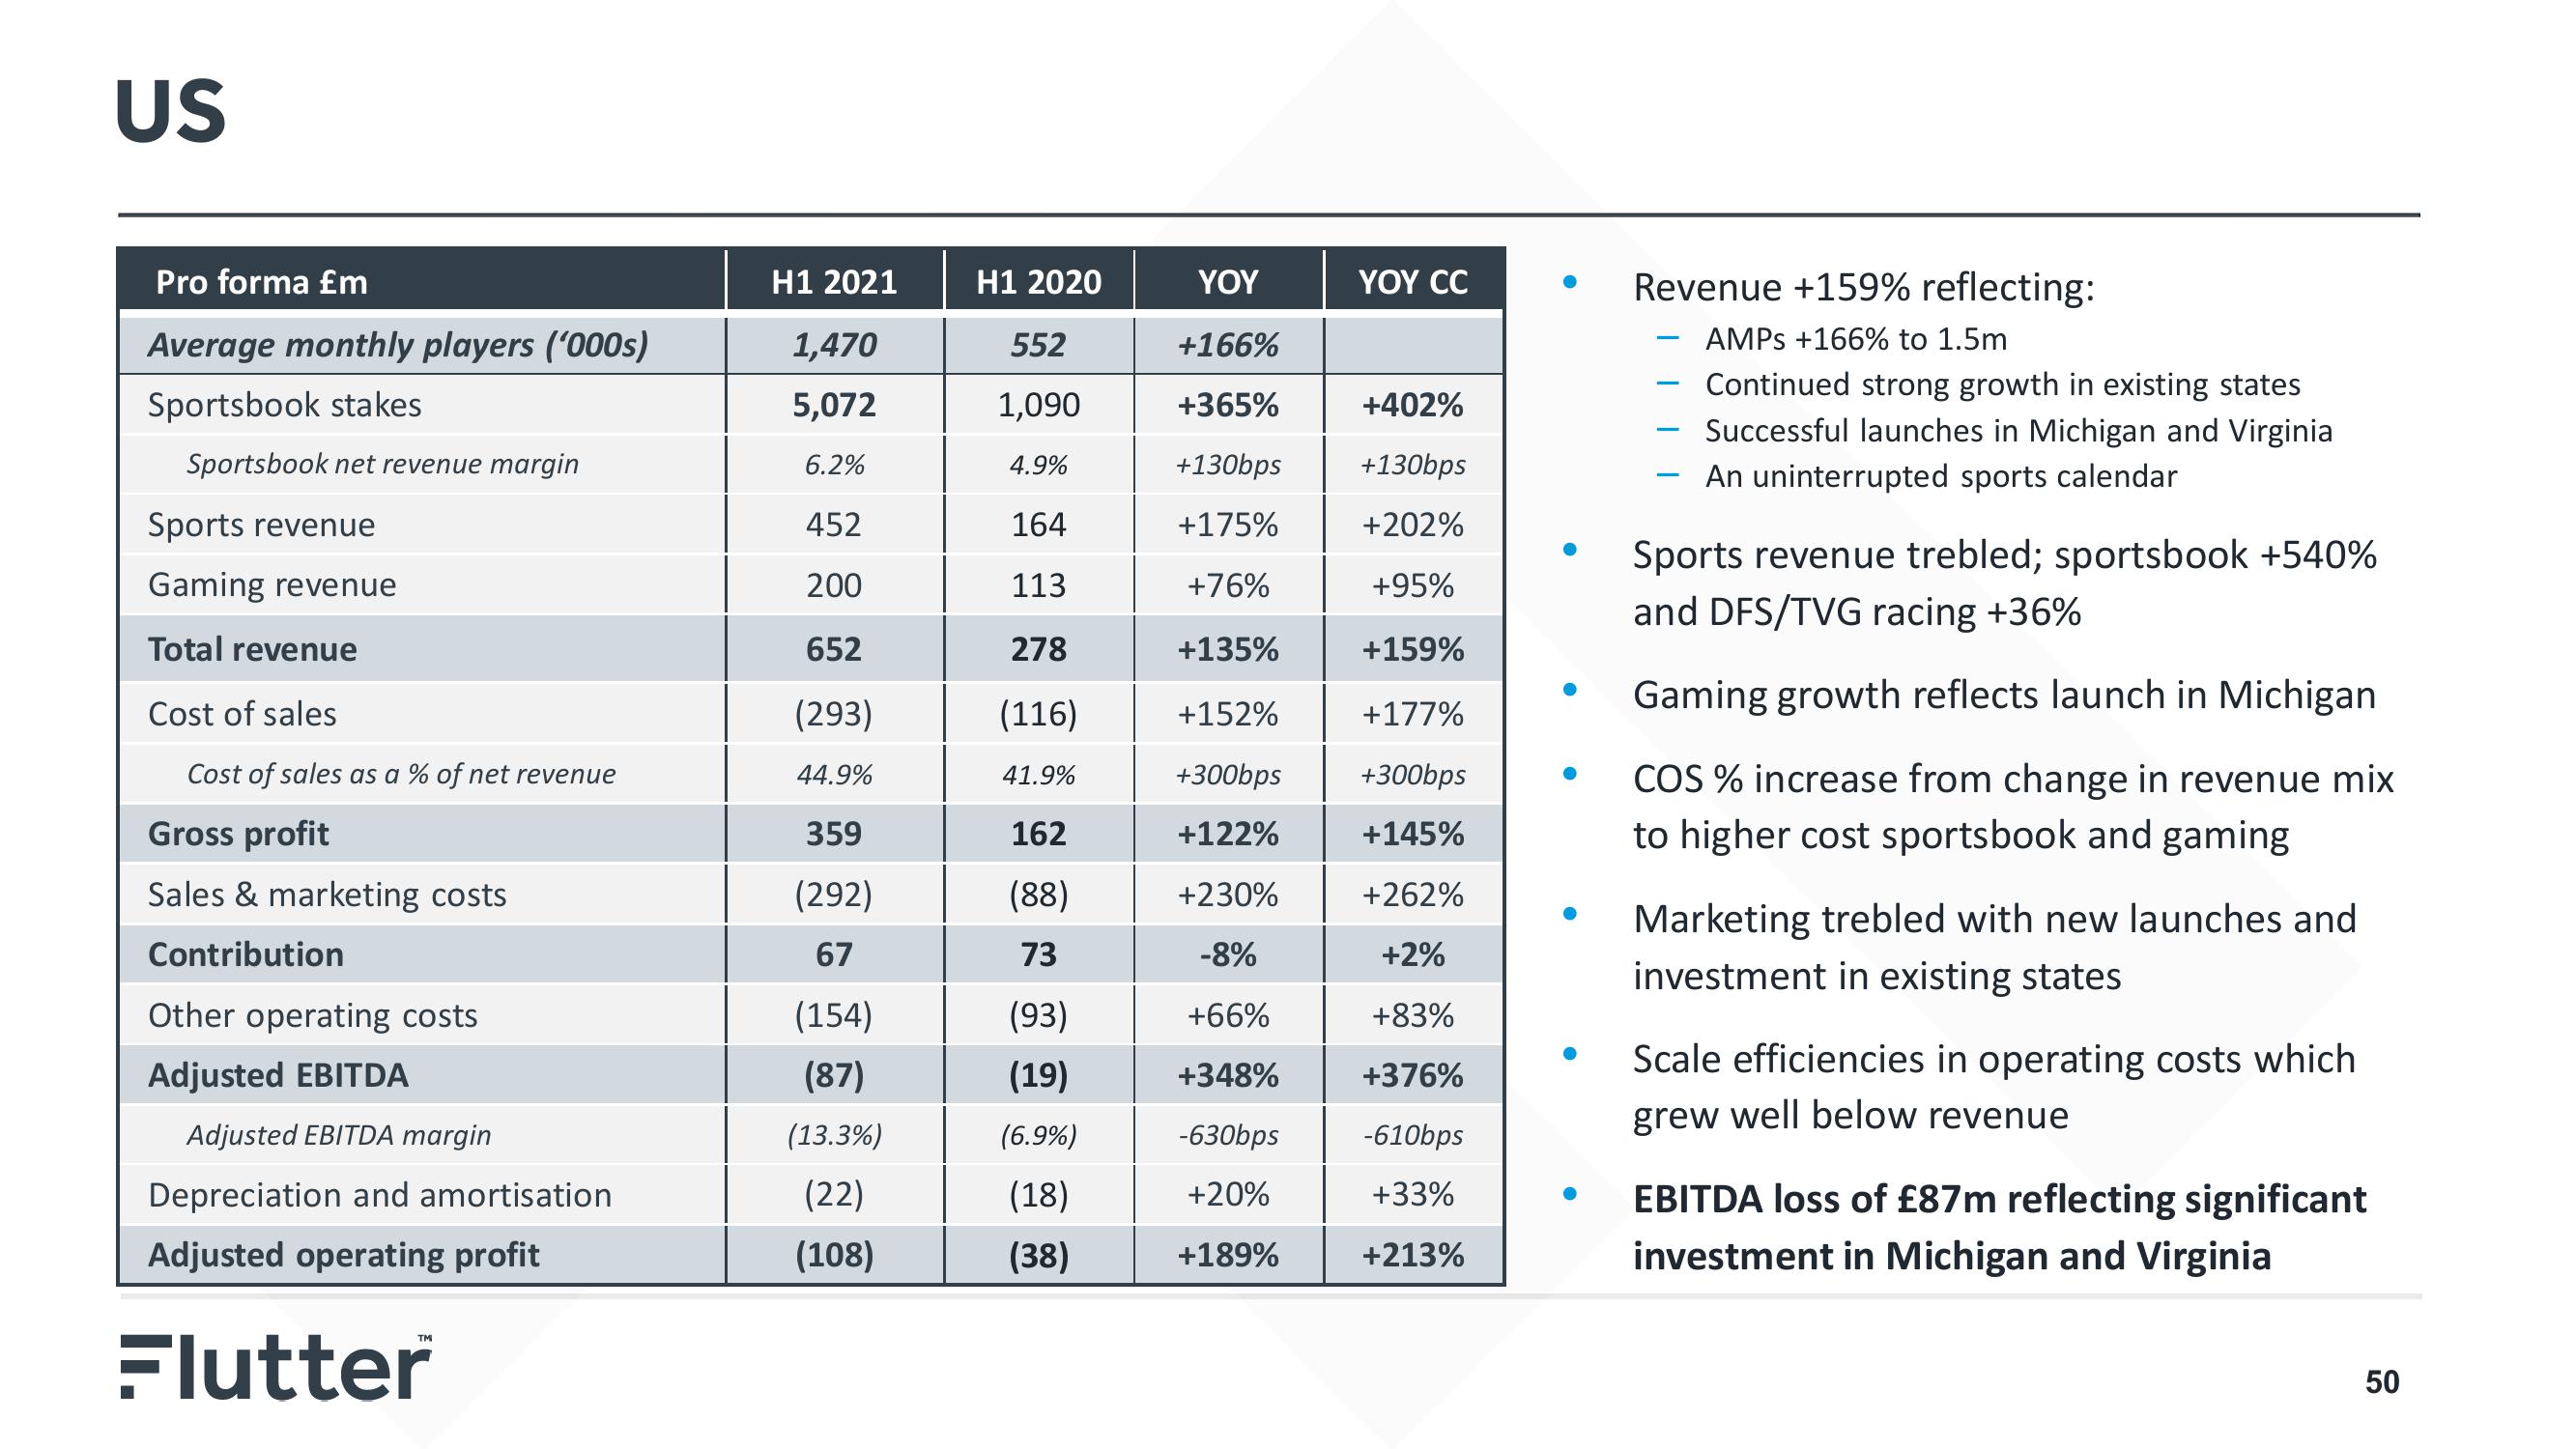
Revenue +159% reflecting:
AMPS +166% to 1.5m
Continued strong growth in existing states
Successful launches in Michigan and Virginia
An uninterrupted sports calendar
-
-
-
Sports revenue trebled; sportsbook +540%
and DFS/TVG racing +36%
Gaming growth reflects launch in Michigan
COS % increase from change in revenue mix
to higher cost sportsbook and gaming
Marketing trebled with new launches and
investment in existing states
Scale efficiencies in operating costs which
grew well below revenue
EBITDA loss of £87m reflecting significant
investment in Michigan and Virginia
50View entire presentation