Snap Inc Results Presentation Deck
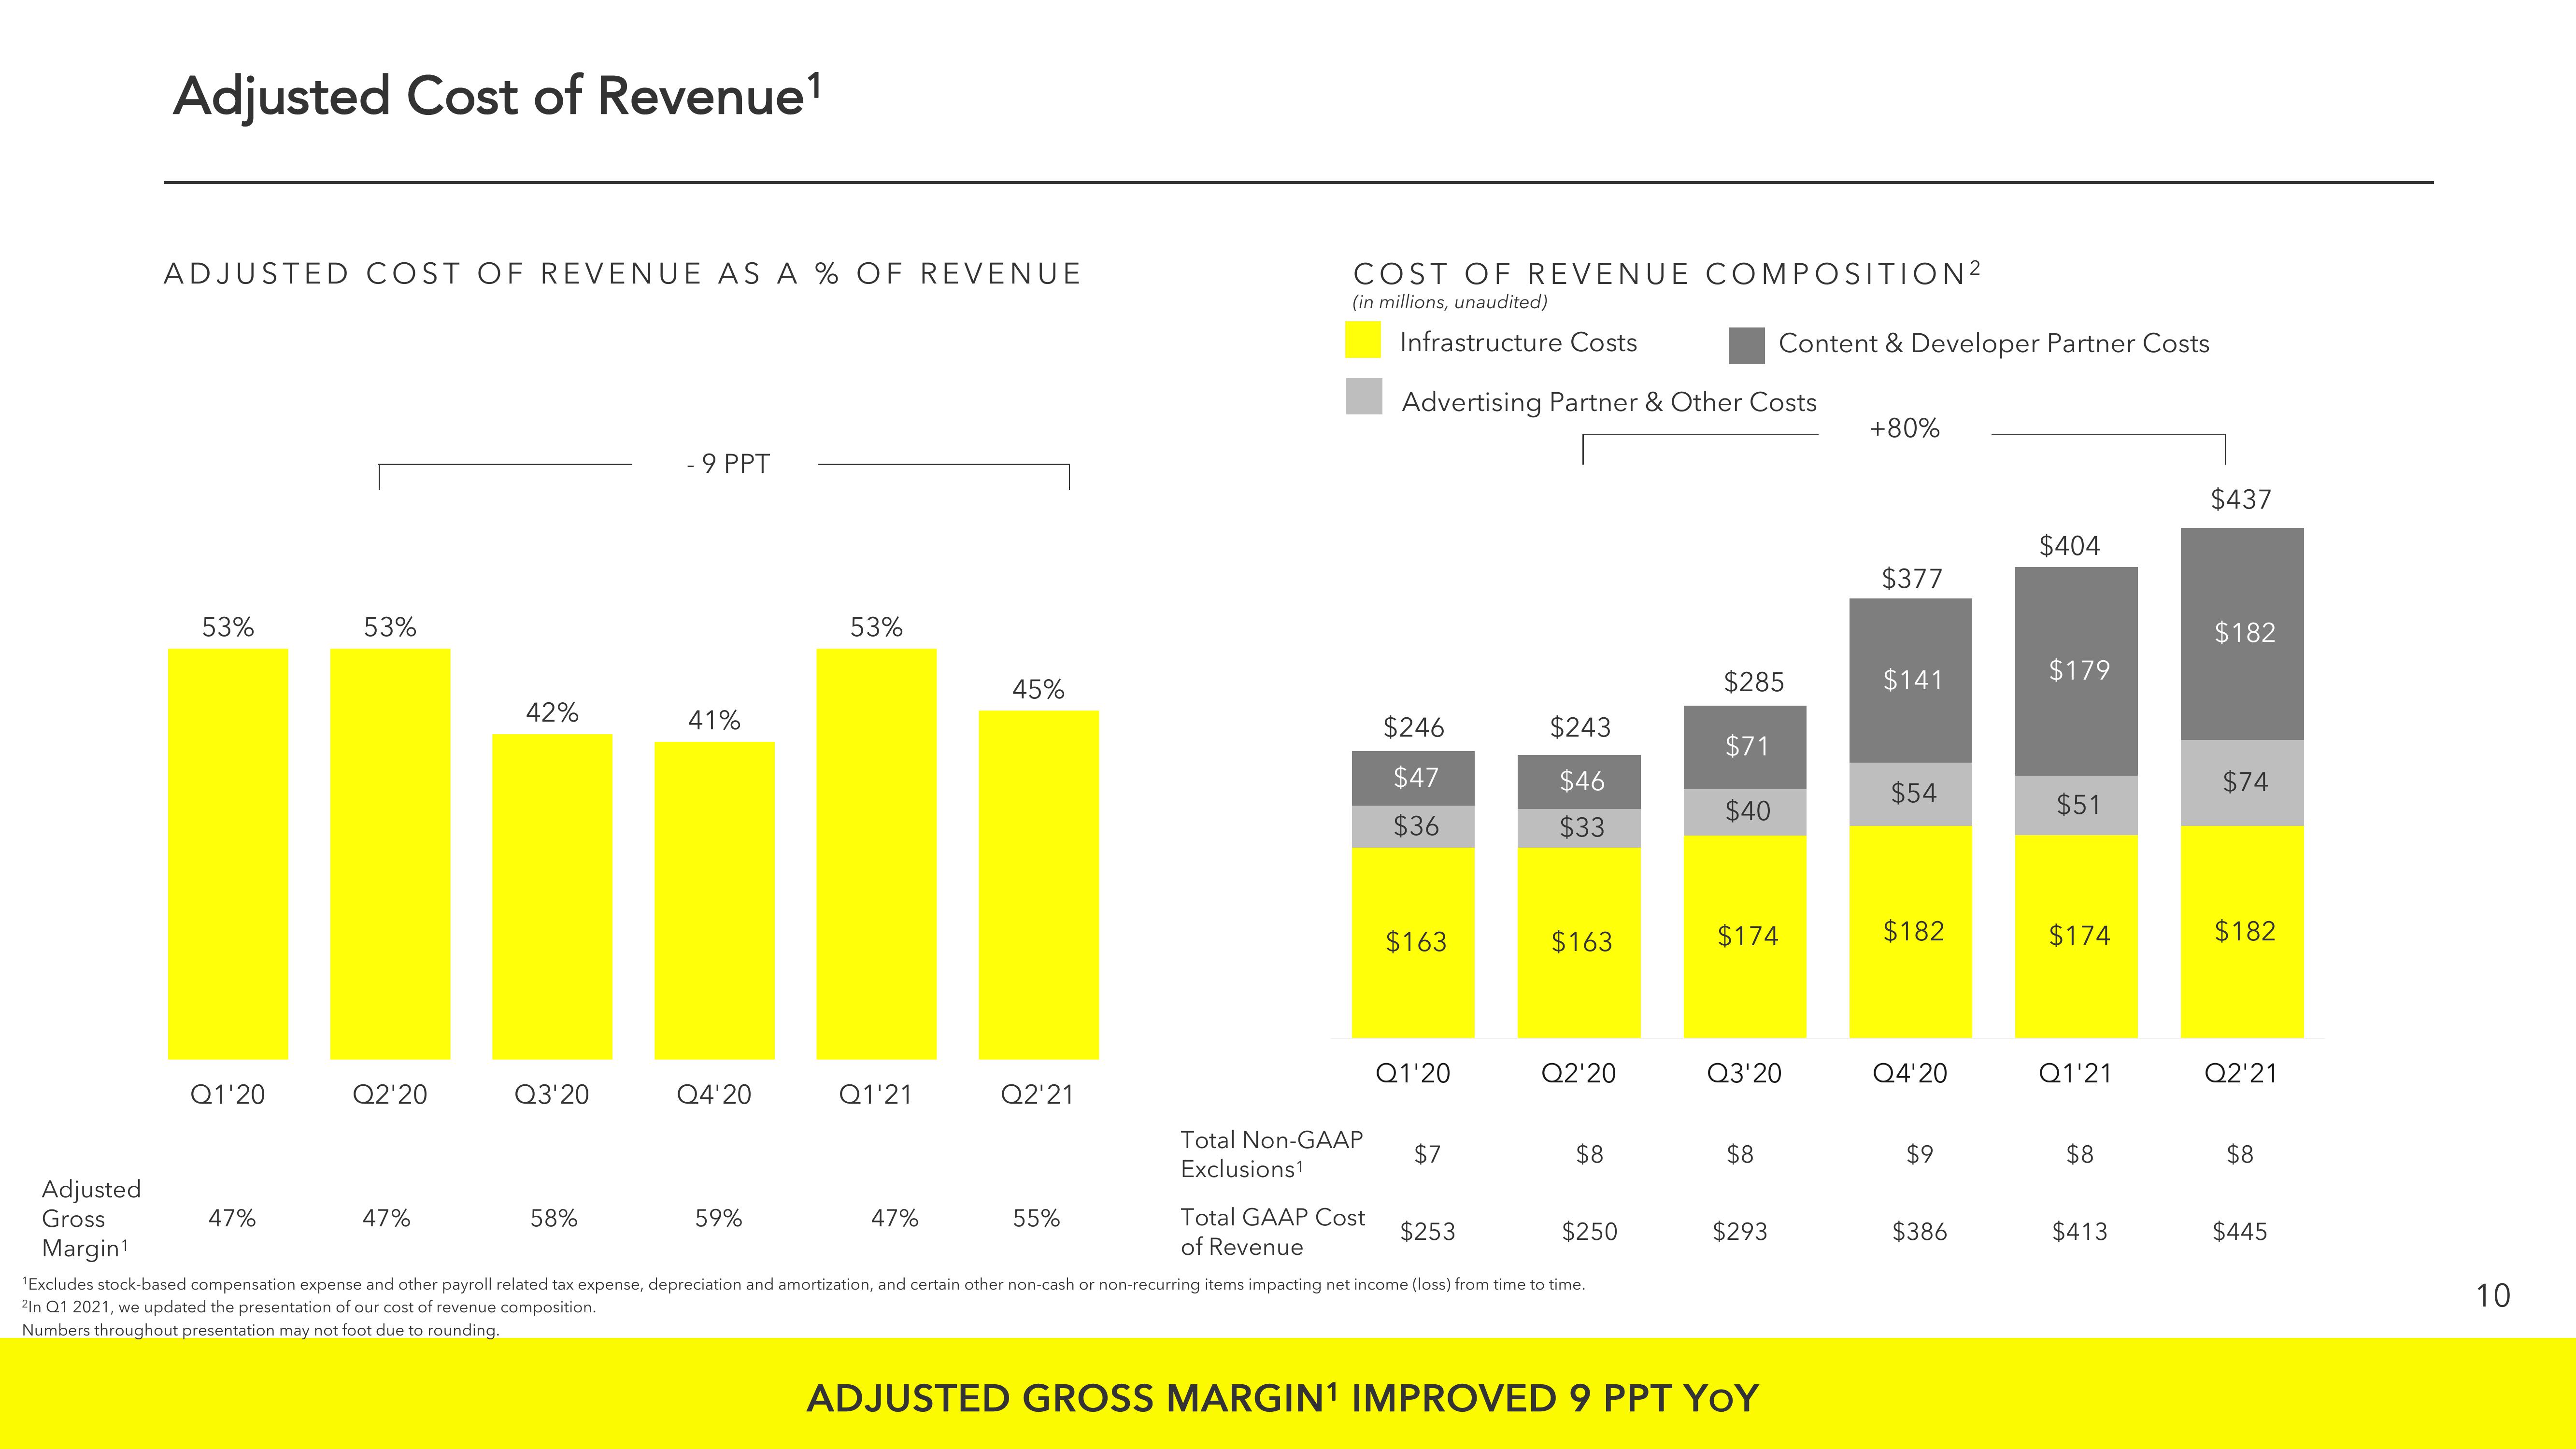
Adjusted Cost of Revenue¹
ADJUSTED COST OF REVENUE AS A % OF REVENUE
53%
Q1'20
53%
47%
Q2'20
42%
47%
Q3'20
- 9 PPT
58%
41%
Q4'20
53%
59%
Q1'21
45%
47%
Q2'21
COST OF REVENUE COMPOSITION²
(in millions, unaudited)
Infrastructure Costs
Advertising Partner & Other Costs
55%
Total Non-GAAP
Exclusions¹
$246
$47
$36
Total GAAP Cost
of Revenue
$163
$253
Adjusted
Gross
Margin¹
¹Excludes stock-based compensation expense and other payroll related tax expense, depreciation and amortization, and certain other non-cash or non-recurring items impacting net income (loss) from time to time.
2In Q1 2021, we updated the presentation of our cost of revenue composition.
Numbers throughout presentation may not foot due to rounding.
Q1'20
$7
$243
$46
$33
$163
Q2'20
$8
$250
$285
$71
$40
$174
Content & Developer Partner Costs
Q3'20
$8
$293
ADJUSTED GROSS MARGIN¹ IMPROVED 9 PPT YOY
+80%
$377
$141
$54
$182
Q4'20
$9
$386
$404
$179
$51
$174
Q1'21
$8
$413
$437
$182
$74
$182
Q2'21
$8
$445
10View entire presentation