Avantor Results Presentation Deck
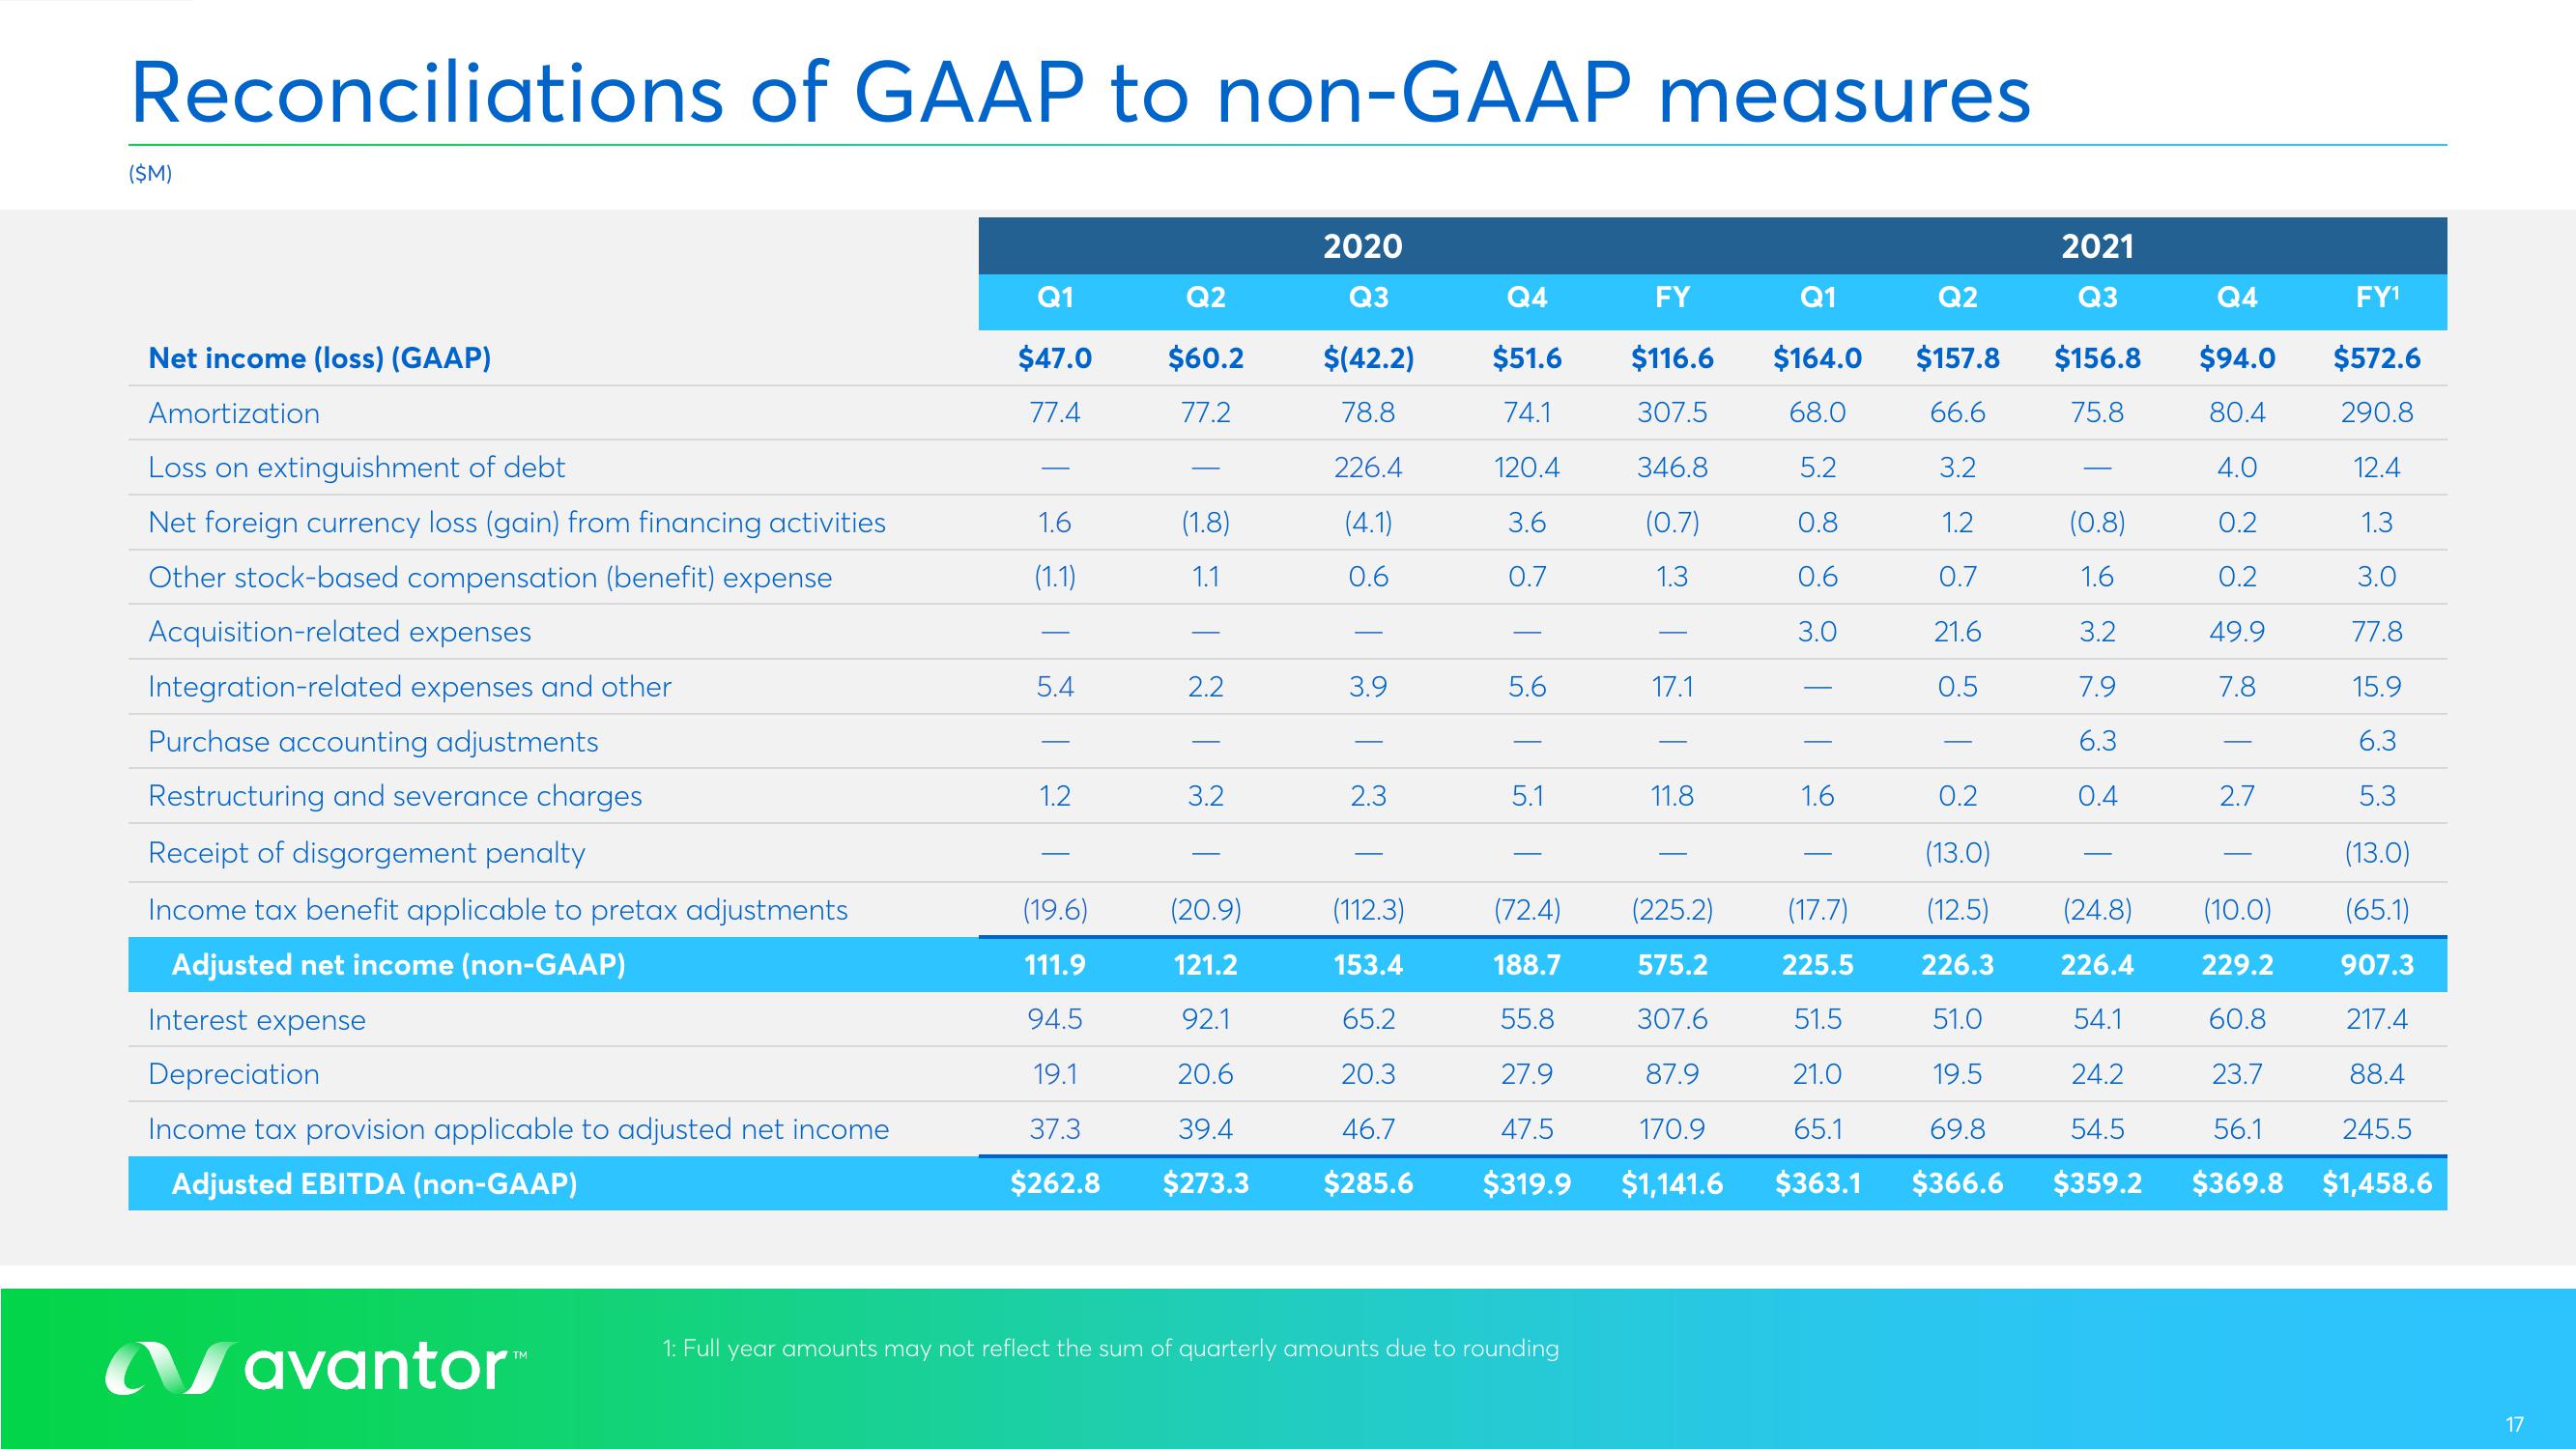
Reconciliations of GAAP to non-GAAP measures
($M)
Net income (loss) (GAAP)
Amortization
Loss on extinguishment of debt
Net foreign currency loss (gain) from financing activities
Other stock-based compensation (benefit) expense
Acquisition-related expenses
Integration-related expenses and other
Purchase accounting adjustments
Restructuring and severance charges
Receipt of disgorgement penalty
Income tax benefit applicable to pretax adjustments
Adjusted net income (non-GAAP)
Interest expense
Depreciation
Income tax provision applicable to adjusted net income
Adjusted EBITDA (non-GAAP)
avantor™
Q1
$47.0
77.4
1.6
(1.1)
| |
5.4
1.2
(19.6)
111.9
94.5
19.1
37.3
$262.8
Q2
$60.2
77.2
(1.8)
1.1
2.2
3.2
2020
Q3
$(42.2)
78.8
226.4
(4.1)
0.6
3.9
-
2.3
(20.9)
(112.3)
121.2
153.4
92.1
65.2
20.6
20.3
39.4
46.7
$273.3 $285.6
Q4
FY
Q1
Q2
$51.6 $116.6 $164.0 $157.8
68.0
66.6
74.1
120.4
307.5
346.8
5.2
3.2
3.6
(0.7)
0.8
1.2
0.7
1.3
0.6
0.7
3.0
21.6
0.5
5.6
-
5.1
(72.4)
188.7
55.8
27.9
47.5
$319.9
1: Full year amounts may not reflect the sum of quarterly amounts due to rounding
17.1
11.8
(225.2)
575.2
307.6
87.9
170.9
$1,141.6
1.6
2021
Q3
Q4
$156.8 $94.0
75.8
80.4
4.0
0.2
0.2
49.9
7.8
(0.8)
1.6
3.2
7.9
6.3
0.4
0.2
(13.0)
(17.7)
225.5
(12.5)
226.3
(24.8)
226.4
51.5
51.0
54.1
21.0
19.5
24.2
65.1
69.8
54.5
$363.1 $366.6 $359.2
FY¹
$572.6
290.8
12.4
1.3
3.0
77.8
15.9
6.3
5.3
(13.0)
(65.1)
(10.0)
229.2
907.3
60.8
217.4
23.7
88.4
56.1 245.5
$369.8 $1,458.6
2.7
17View entire presentation