Dutch Bros Results Presentation Deck
($ in thousands; except per share data)
Revenues:
INCOME STATEMENT
Company-operated stores
Franchising and other
Total revenues
Costs and expenses:
Cost of sales
Selling, general and administrative
Total costs and expenses
Income from operations
Other expense:
Interest expense, net
Other income (expense), net
Total other expense
Income (loss) before income taxes
Income tax expense
Net income (loss)
Less: Net income attributable to Dutch Bros OpCo prior to the reorganization transactions
Less: Net loss attributable to non-controlling interests
Net loss attributable to Dutch Bros Inc.
Net loss per share of class A and class D common stock:
Basic
Diluted
1
Weighted-average shares of class A and class D common stock outstanding:
Basic
Diluted
$
GA
SA
SA
GA
LA CA
$
Three Months Ended June 30,
2022
2021 1
160,512 $
25,869
186,381 $
141,370
42,342
183,712
2,669
(3,596)
61
(3,535)
(866) $
885
(1,751) $
(845)
(906) $
(0.02)
(0.02)
50,926
50,926
102,970
26,238
129,208
81,467
33,488
114,955
14,253
(1,838)
(5)
(1,843)
12,410
521
11,889
11,889
N/A
N/A
N/A
N/A
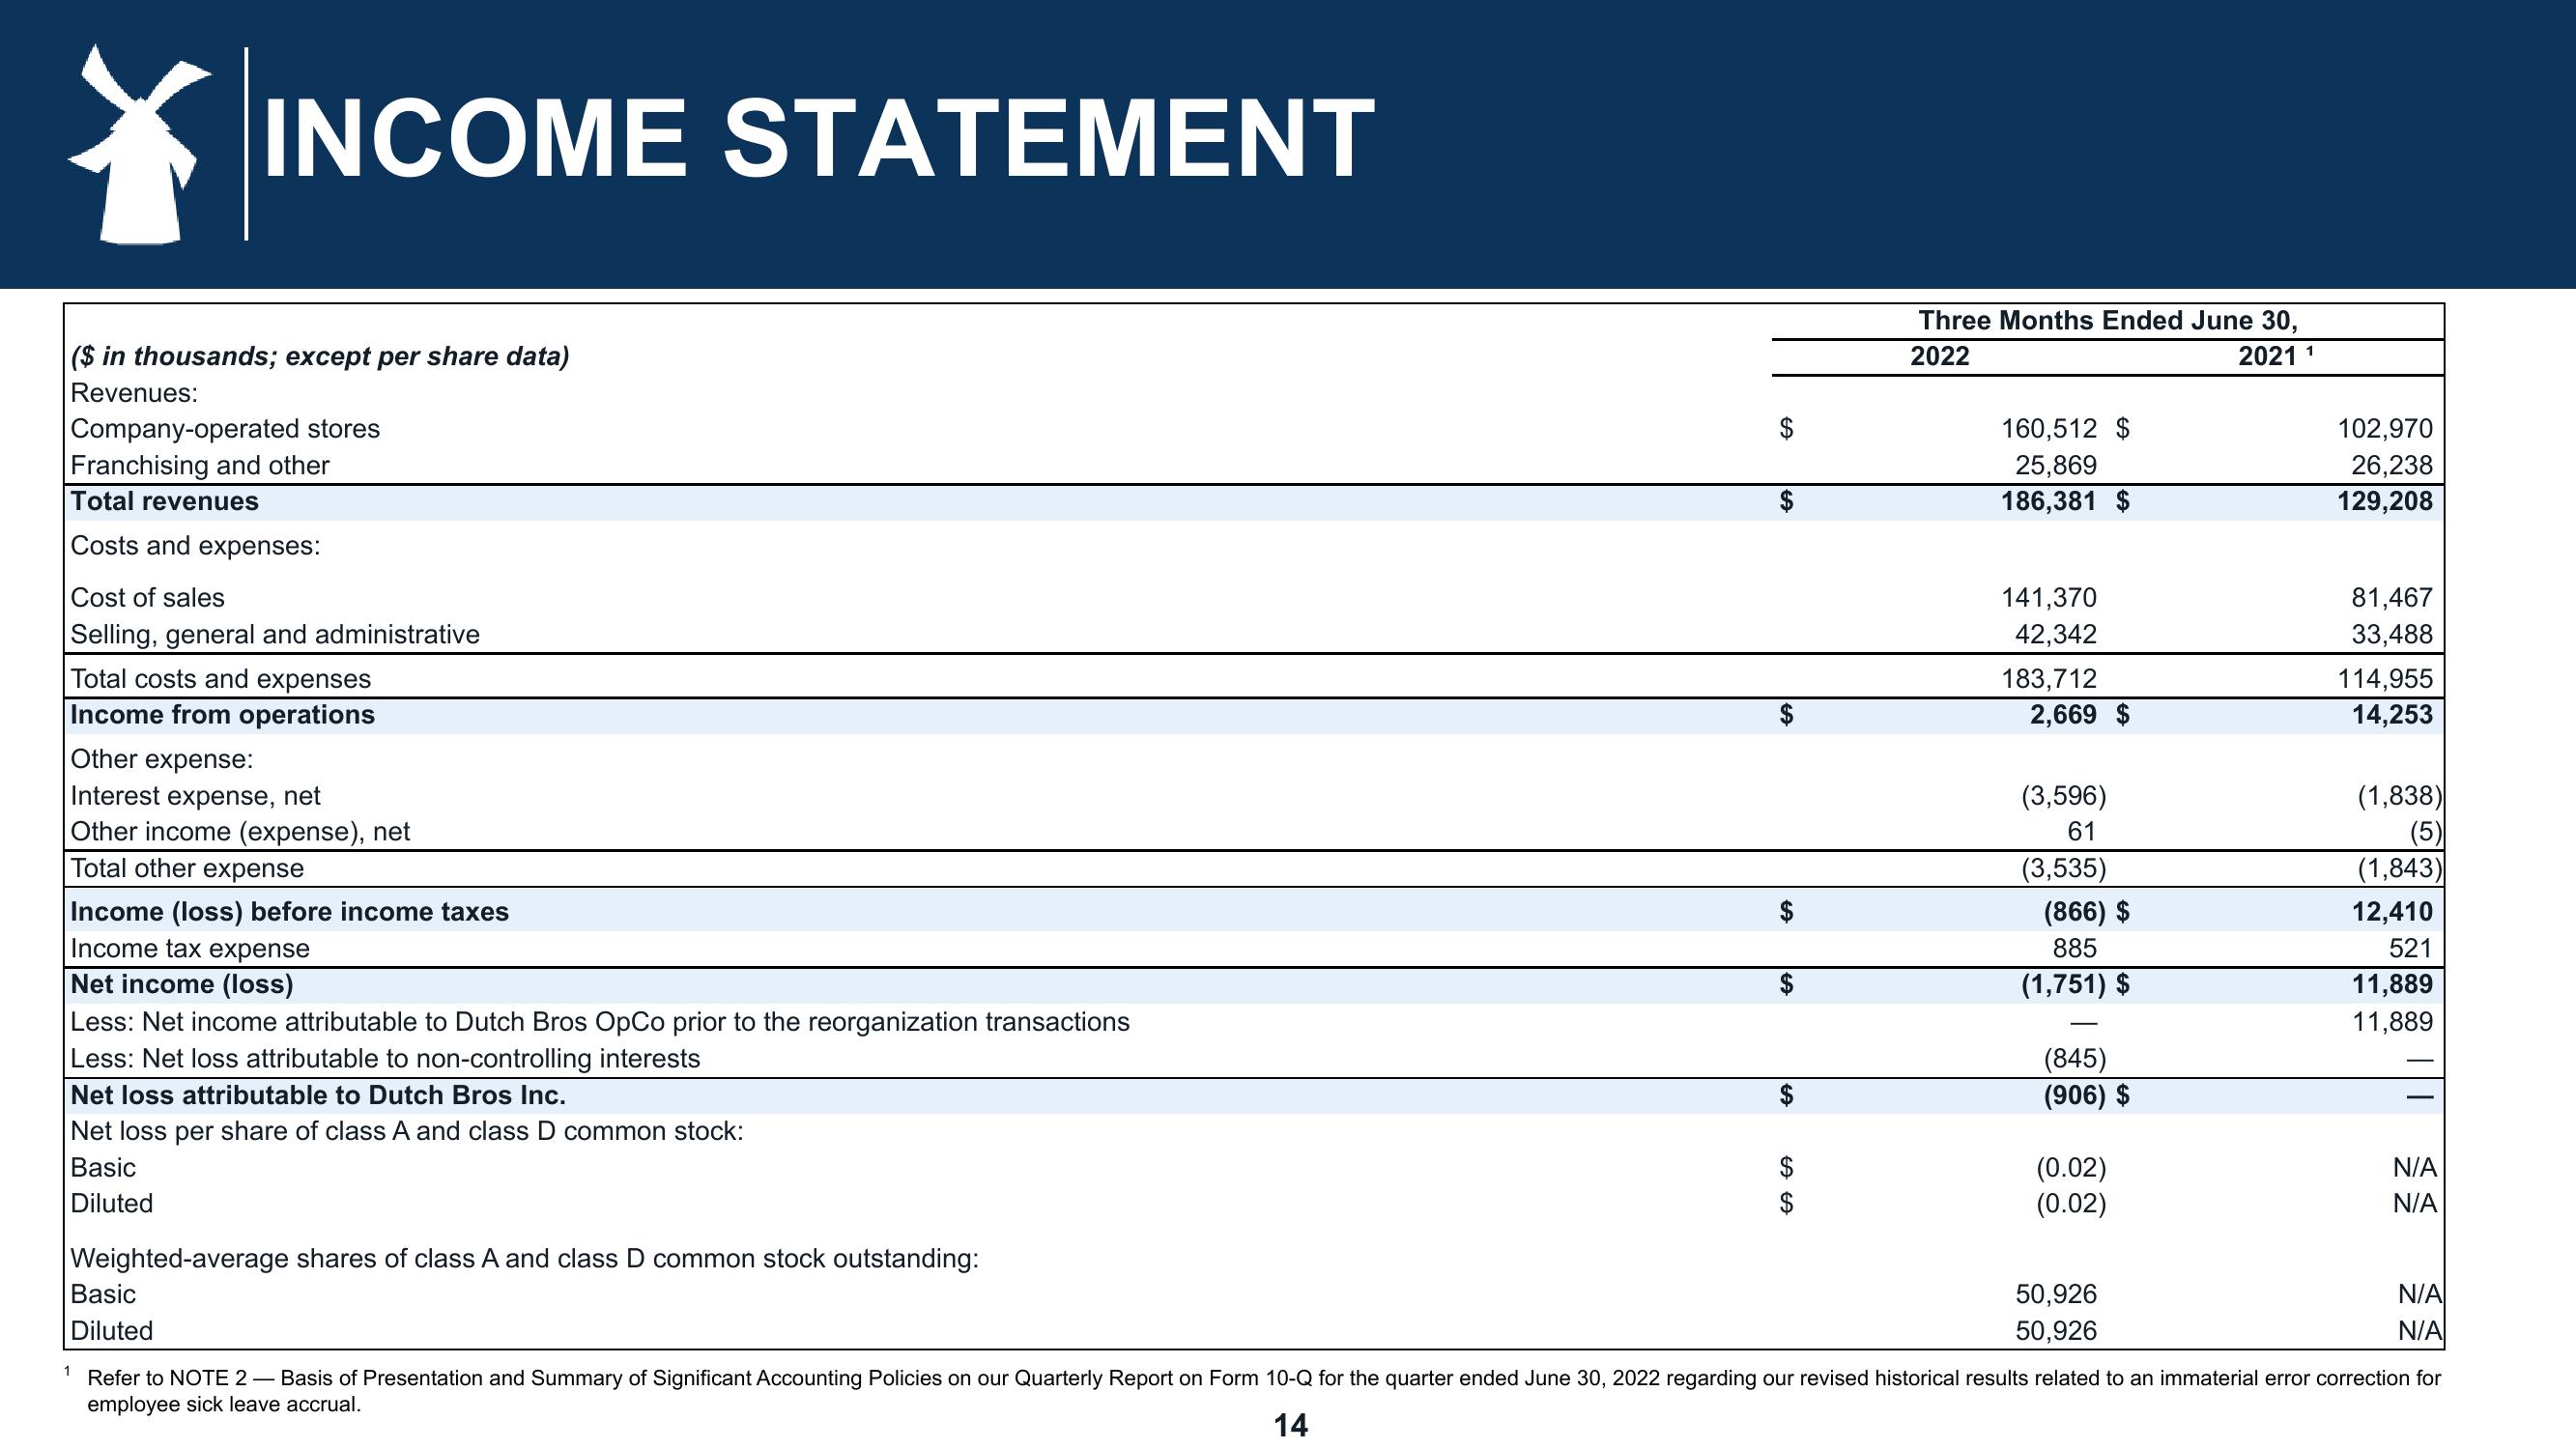
Refer to NOTE 2 - Basis of Presentation and Summary of Significant Accounting Policies on our Quarterly Report on Form 10-Q for the quarter ended June 30, 2022 regarding our revised historical results related to an immaterial error correction for
employee sick leave accrual.
14View entire presentation