First Quarter 2023 Earnings Conference Call
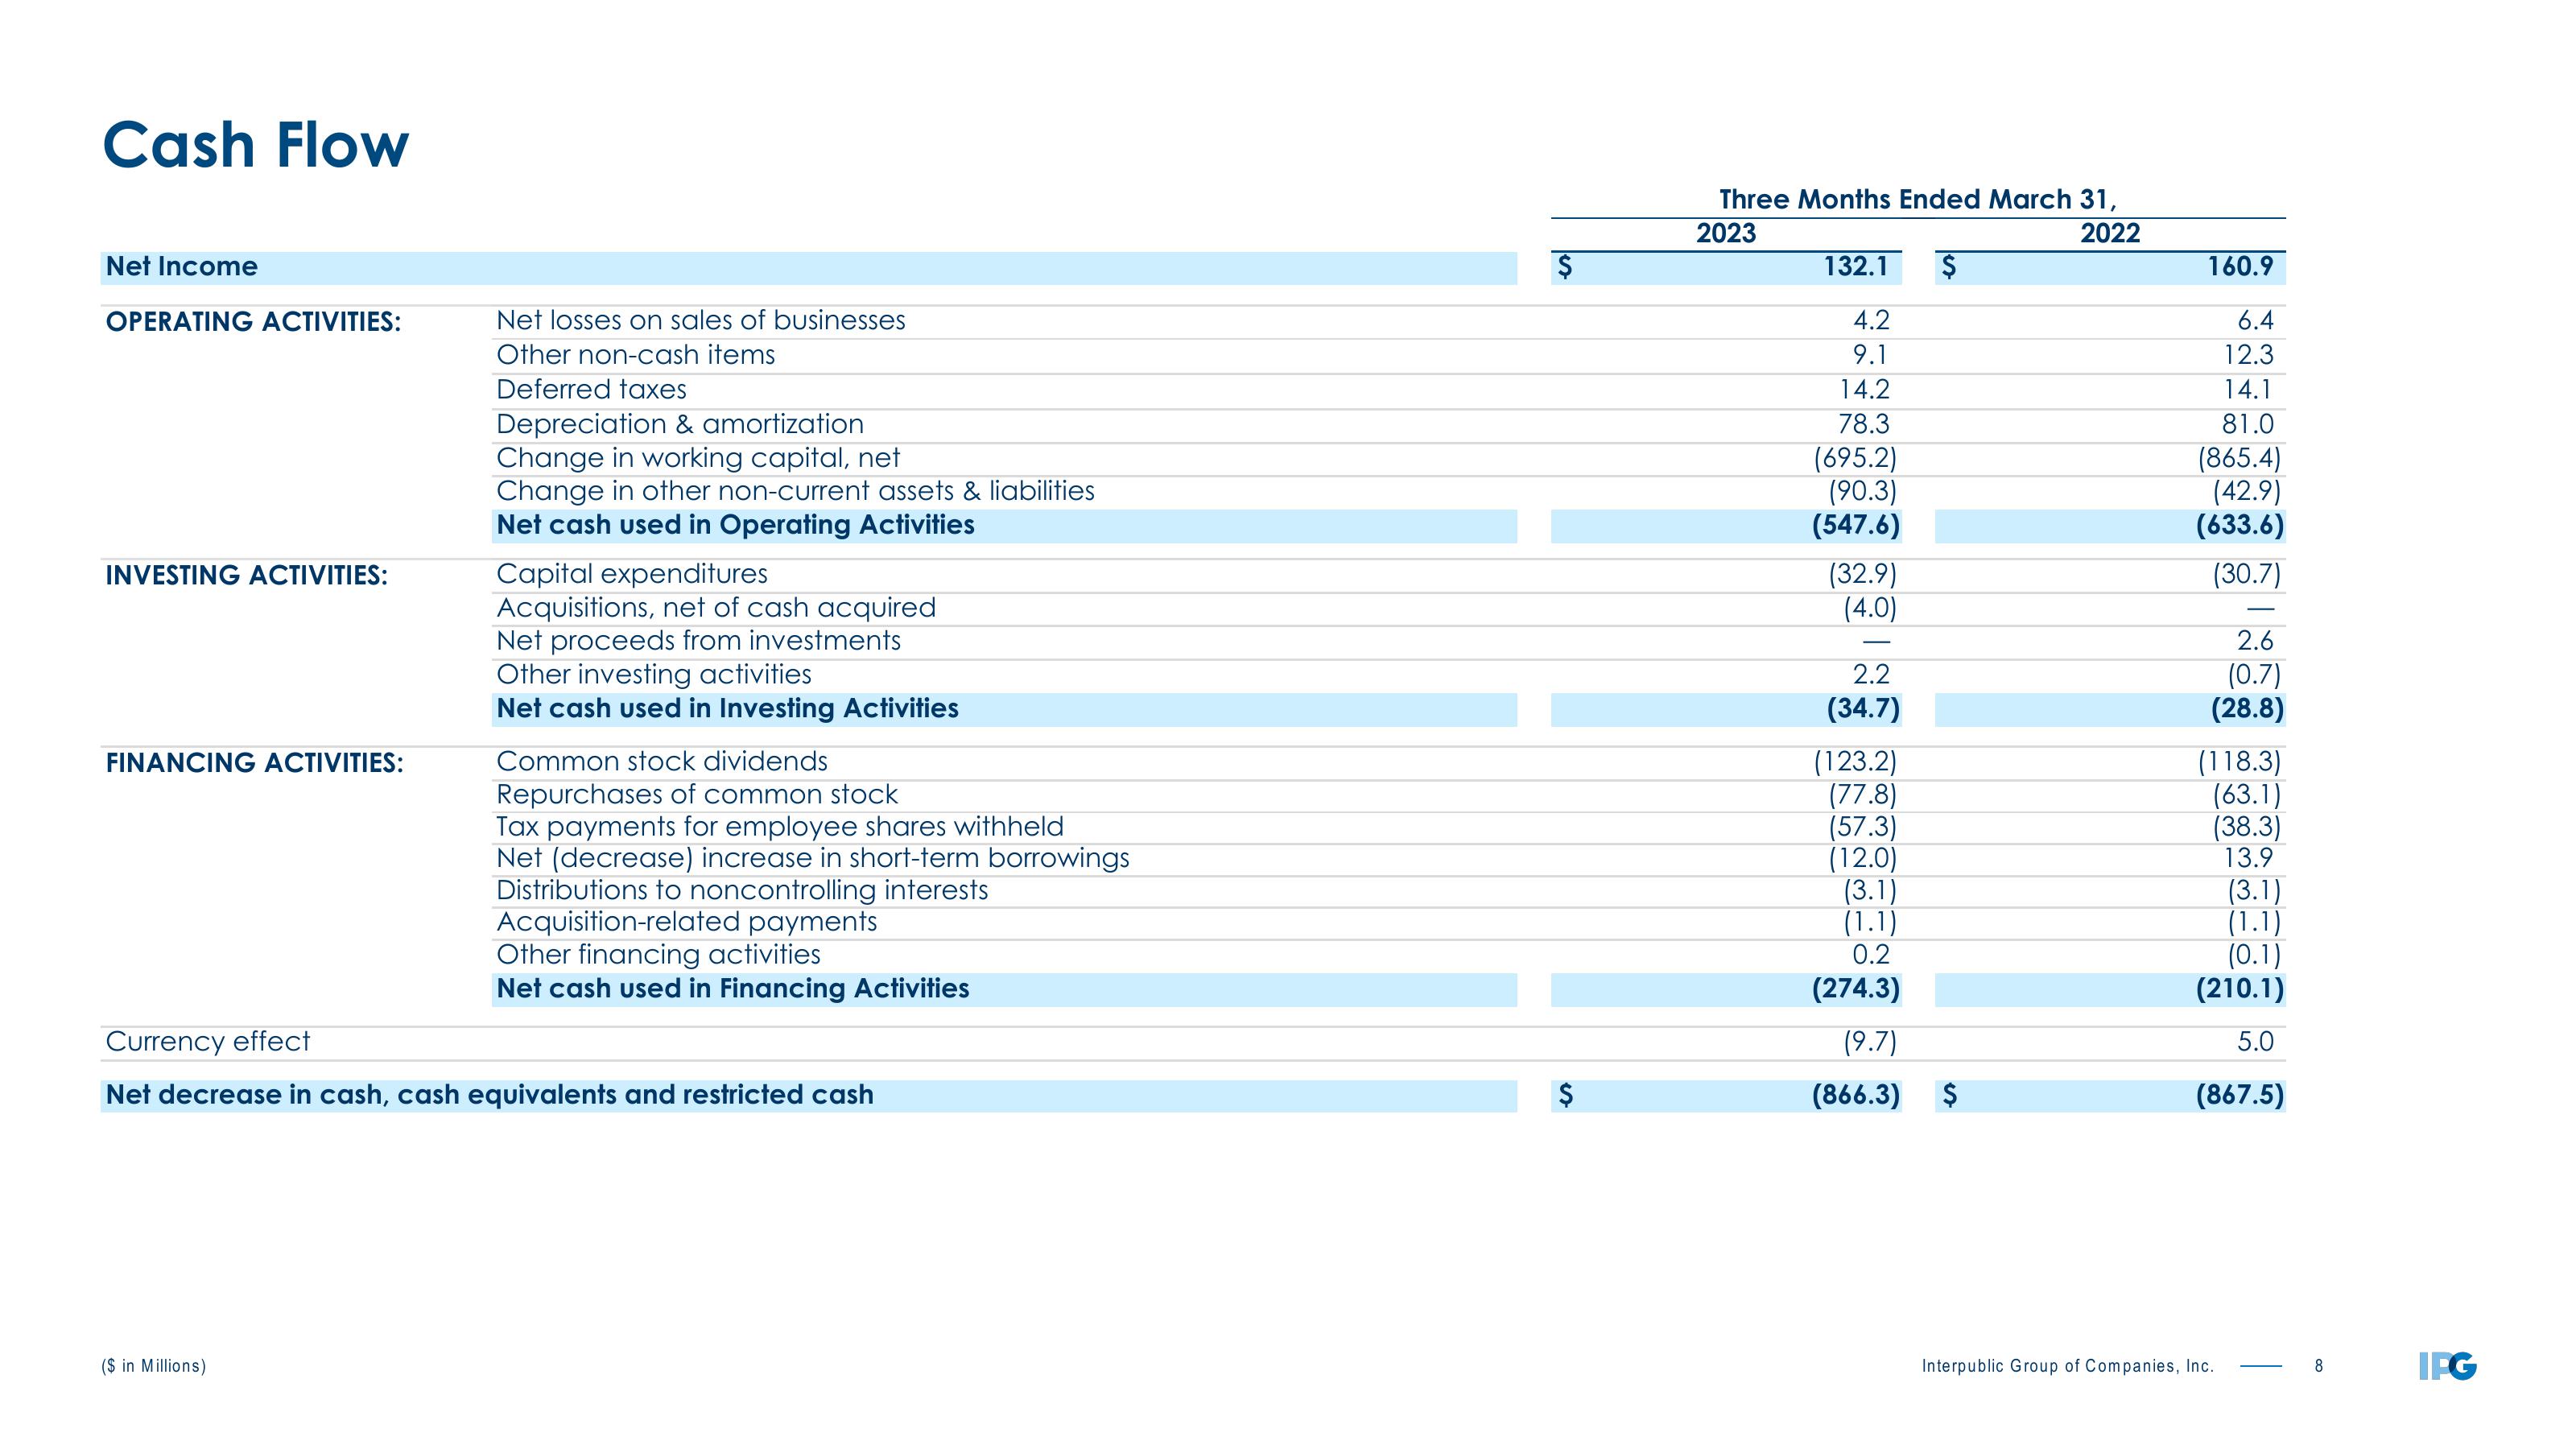
Cash Flow
Net Income
OPERATING ACTIVITIES:
INVESTING ACTIVITIES:
FINANCING ACTIVITIES:
Net losses on sales of businesses
Other non-cash items
Deferred taxes
($ in Millions)
Depreciation & amortization
Change in working capital, net
Change in other non-current assets & liabilities
Net cash used in Operating Activities
Capital expenditures
Acquisitions, net of cash acquired
Net proceeds from investments
Other investing activities
Net cash used in Investing Activities
Common stock dividends
Repurchases of common stock
Tax payments for employee shares withheld
Net (decrease) increase in short-term borrowings
Distributions to noncontrolling interests
Acquisition-related payments
Other financing activities
Net cash used in Financing Activities
Currency effect
Net decrease in cash, cash equivalents and restricted cash
$
$
Three Months Ended March 31,
2023
2022
132.1
4.2
9.1
14.2
78.3
(695.2)
(90.3)
(547.6)
(32.9)
(4.0)
2.2
(34.7)
(123.2)
(77.8)
(57.3)
(12.0)
$
(3.1)
(1.1)
0.2
(274.3)
(9.7)
(866.3) $
160.9
6.4
12.3
14.1
81.0
(865.4)
(42.9)
(633.6)
(30.7)
2.6
(0.7)
(28.8)
(118.3)
(63.1)
(38.3)
13.9
(3.1)
(1.1)
(0.1)
(210.1)
5.0
(867.5)
Interpublic Group of Companies, Inc.
8
IPGView entire presentation