Blend Results Presentation Deck
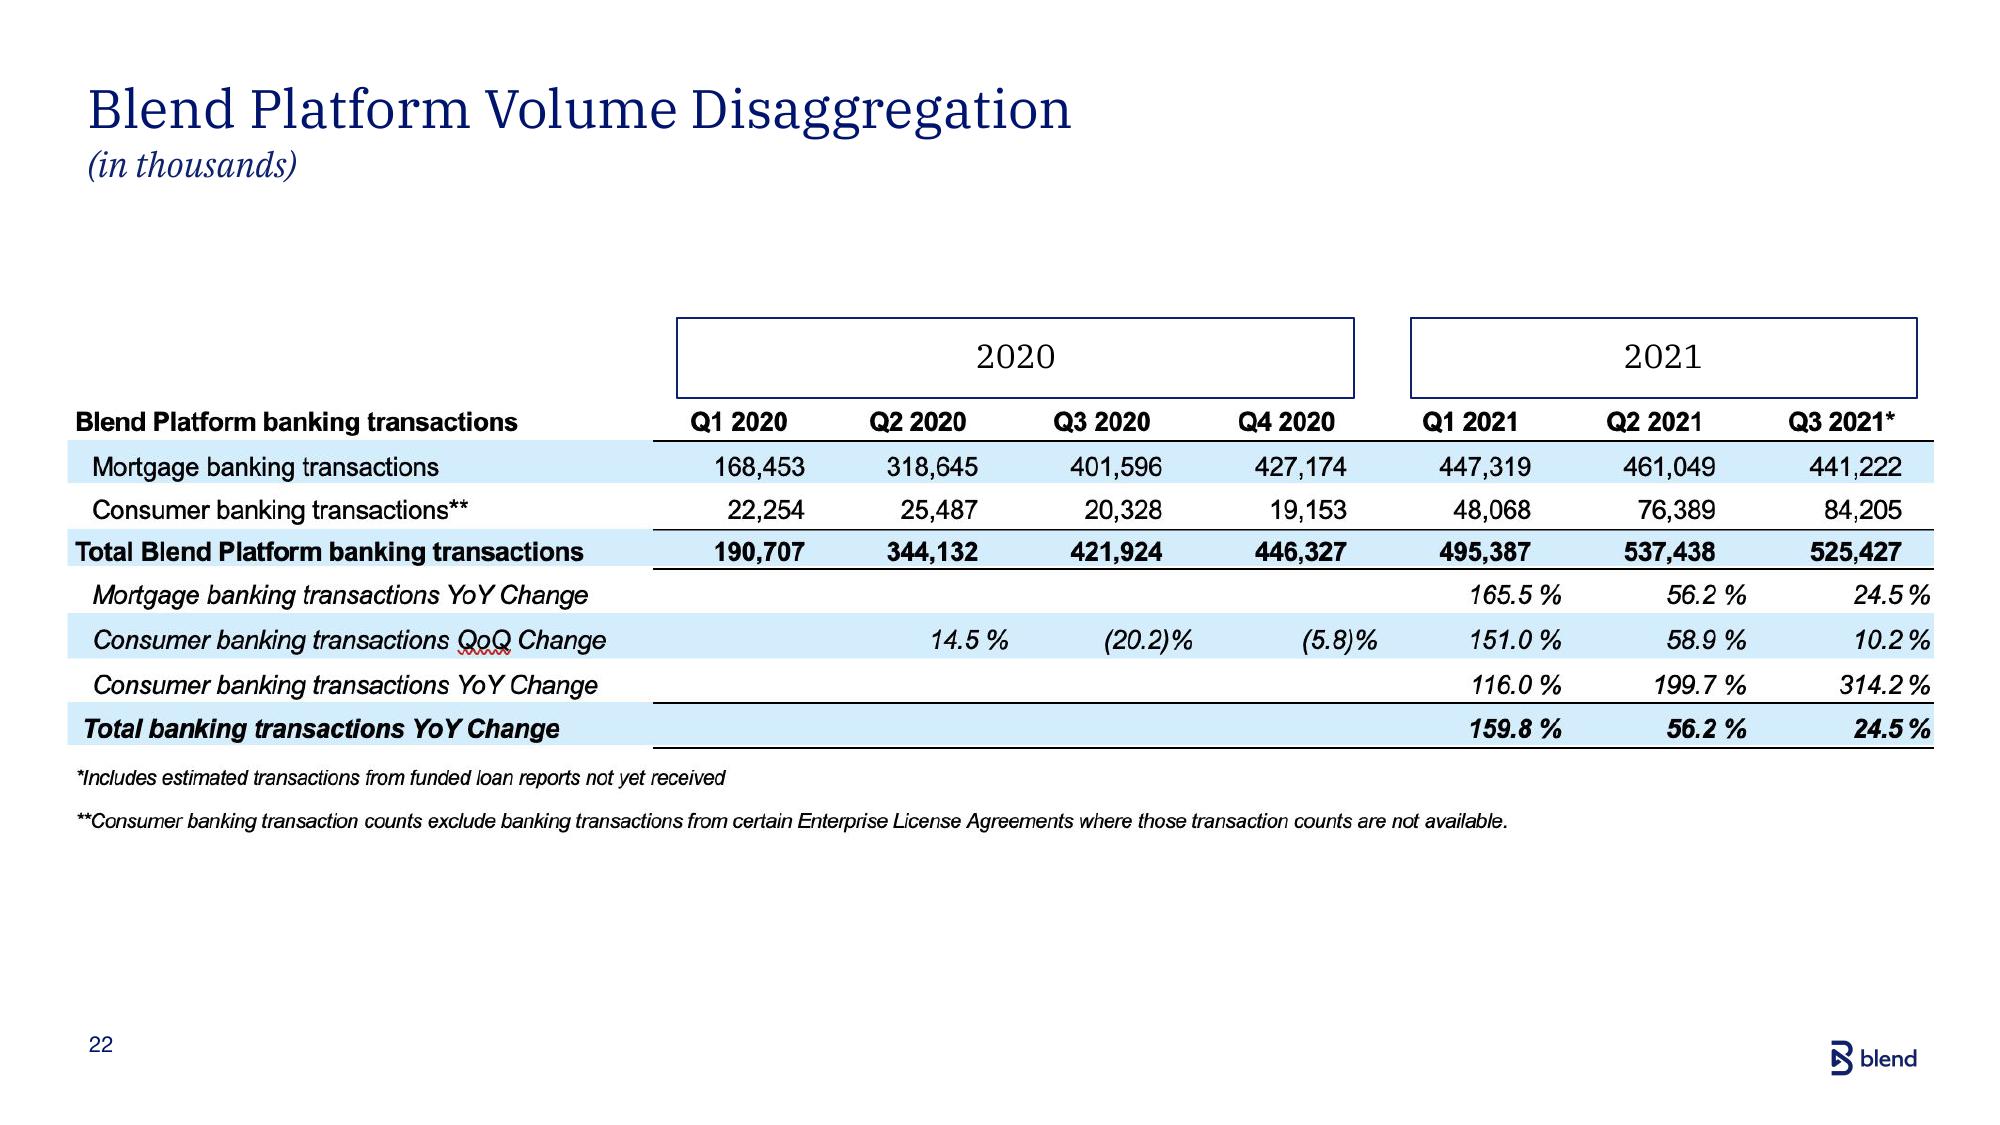
Blend Platform Volume Disaggregation
(in thousands)
Blend Platform banking transactions
Mortgage banking transactions
Consumer banking transactions**
Total Blend Platform banking transactions
Mortgage banking transactions YoY Change
Consumer banking transactions QoQ Change
Consumer banking transactions YoY Change
Total banking transactions YoY Change
*Includes estimated transactions from funded loan reports not yet received
**Consumer banking transaction counts exclude banking transactions from certain Enterprise License Agreements where those transaction counts are not available.
Q1 2020
168,453
22,254
190,707
22
2020
Q2 2020
318,645
25,487
344,132
Q3 2020
401,596
20,328
421,924
14.5%
(20.2)%
Q4 2020
427,174
19,153
446,327
(5.8)%
Q1 2021
447,319
48,068
495,387
165.5%
151.0 %
116.0%
159.8 %
2021
Q2 2021
461,049
76,389
537,438
56.2%
58.9 %
199.7%
56.2 %
Q3 2021*
441,222
84,205
525,427
24.5%
10.2%
314.2%
24.5%
blendView entire presentation