jetBlue Results Presentation Deck
TAKING ACTIONS TO PROTECT OUR STAKEHOLDERS
●
3Q 2020 BALANCE SHEET
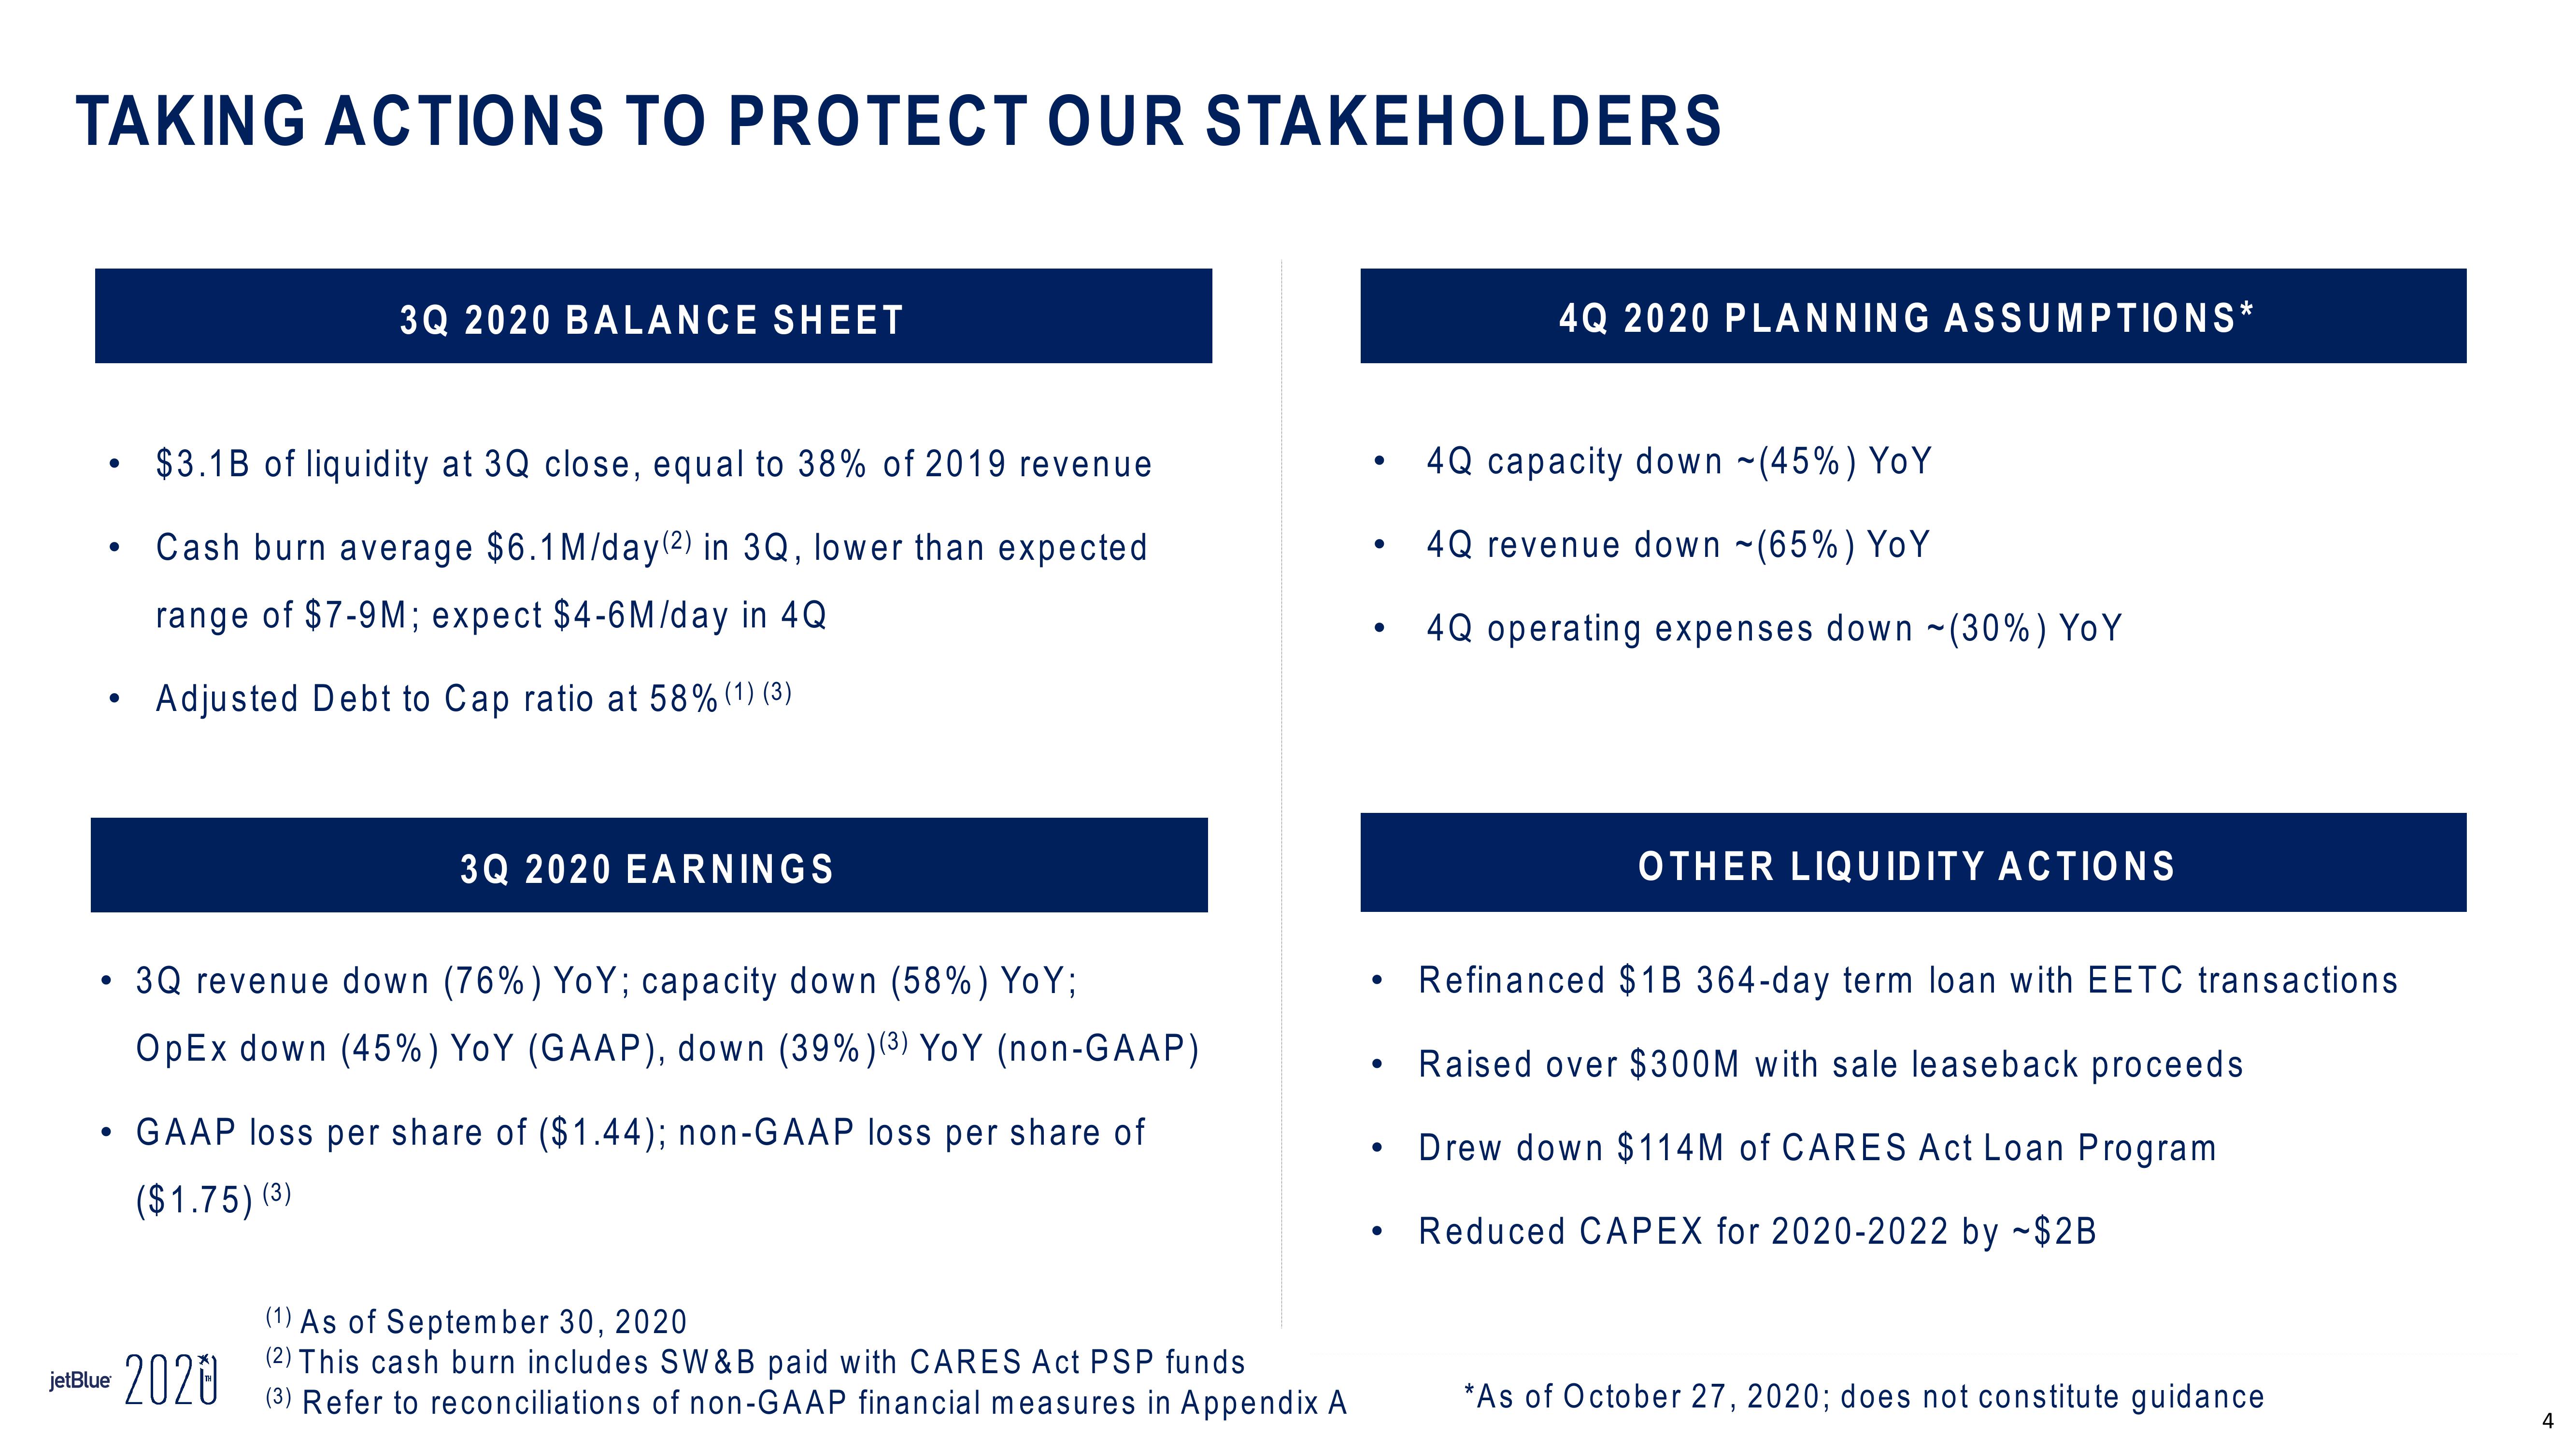
$3.1B of liquidity at 3Q close, equal to 38% of 2019 revenue
Cash burn average $6.1 M/day (2) in 3Q, lower than expected
range of $7-9M; expect $4-6M/day in 4Q
Adjusted Debt to Cap ratio at 58% (1) (3)
jetBlue 2020
3Q 2020 EARNINGS
3Q revenue down (76%) YoY; capacity down (58%) YoY;
OpEx down (45%) YoY (GAAP), down (39%) (3) YoY (non-GAAP)
GAAP loss per share of ($1.44); non-GAAP loss per share of
($1.75) (3)
(1) As of September 30, 2020
(2) This cash burn includes SW&B paid with CARES Act PSP funds
(3) Refer to reconciliations of non-GAAP financial measures in Appendix A
●
●
●
●
●
●
4Q 2020 PLANNING ASSUMPTIONS*
4Q capacity down ~(45%) Yo Y
4Q revenue down ~(65%) YoY
4Q operating expenses down ~(30%) YoY
OTHER LIQUIDITY ACTIONS
Refinanced $1B 364-day term loan with EETC transactions
Raised over $300M with sale leaseback proceeds
Drew down $114M of CARES Act Loan Program
Reduced CAPEX for 2020-2022 by ~$2B
*As of October 27, 2020; does not constitute guidance
4View entire presentation