Investor Presentation
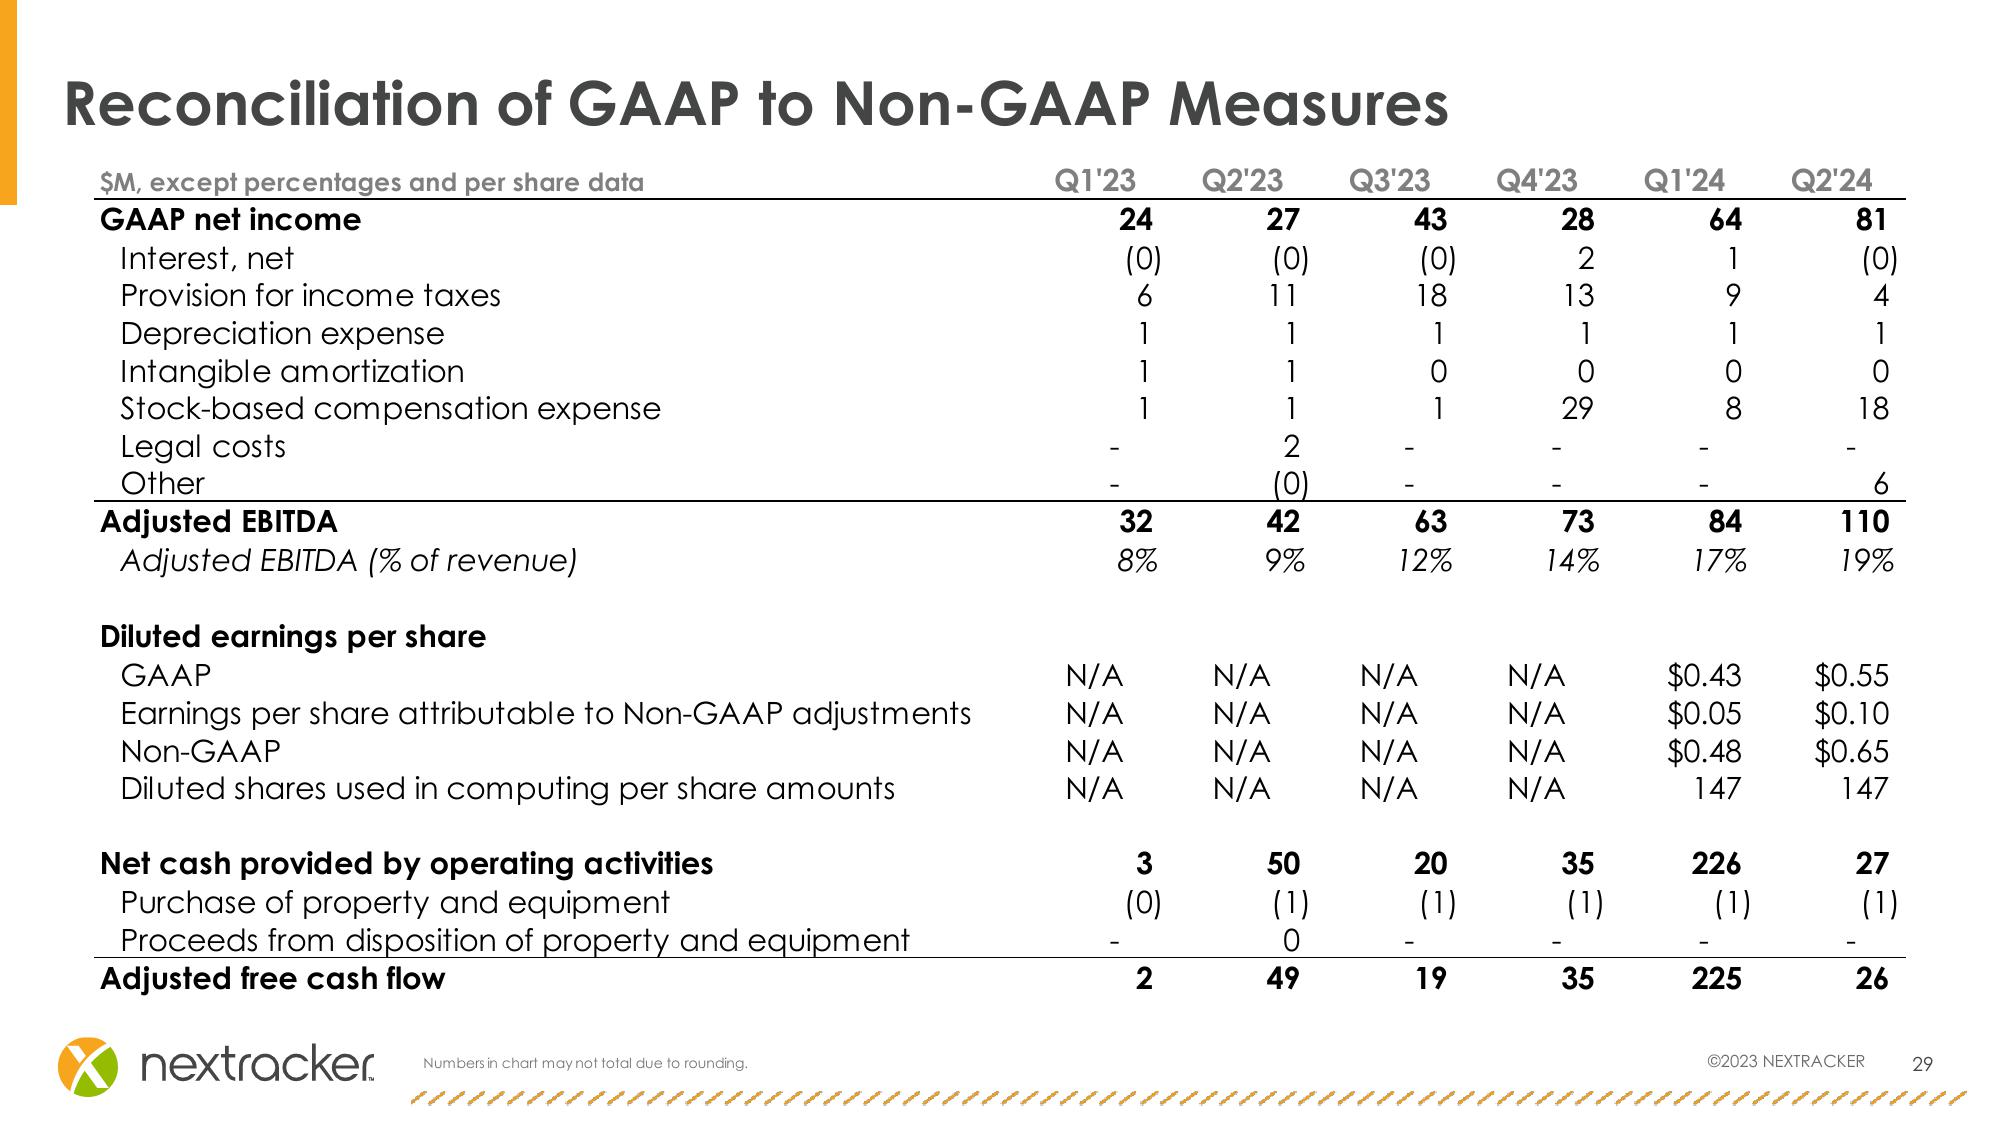
Reconciliation of GAAP to Non-GAAP Measures
$M, except percentages and per share data
GAAP net income
Interest, net
Provision for income taxes
Depreciation expense
Q1'23
24
Q2'23
27
Q3'23
43
Q4'23
Q1'24
Q2'24
28
64
81
(0)
(0)
(0)
2
1
(0)
6
11
18
1
1
1
Intangible amortization
1
1
0
Stock-based compensation expense
1
29
16
13-02
9
1
0
0
18
Legal costs
2
Other
(0)
Adjusted EBITDA
32
42
63
73
84
110
Adjusted EBITDA (% of revenue)
8%
9%
12%
14%
17%
19%
Diluted earnings per share
GAAP
N/A
N/A
N/A
N/A
$0.43
$0.55
Earnings per share attributable to Non-GAAP adjustments
Non-GAAP
N/A
N/A
N/A
N/A
$0.05
$0.10
N/A
N/A
N/A
N/A
$0.48
$0.65
Diluted shares used in computing per share amounts
N/A
N/A
N/A
N/A
147
147
Net cash provided by operating activities
Purchase of property and equipment
Proceeds from disposition of property and equipment
Adjusted free cash flow
3
50
(0)
(1)
0
2
49
。 =8
35
226
27
(1)
(1)
(1)
(1)
35
225
26
nextracker.
Numbers in chart may not total due to rounding.
©2023 NEXTRACKER
29View entire presentation