Apollo Global Management Investor Day Presentation Deck
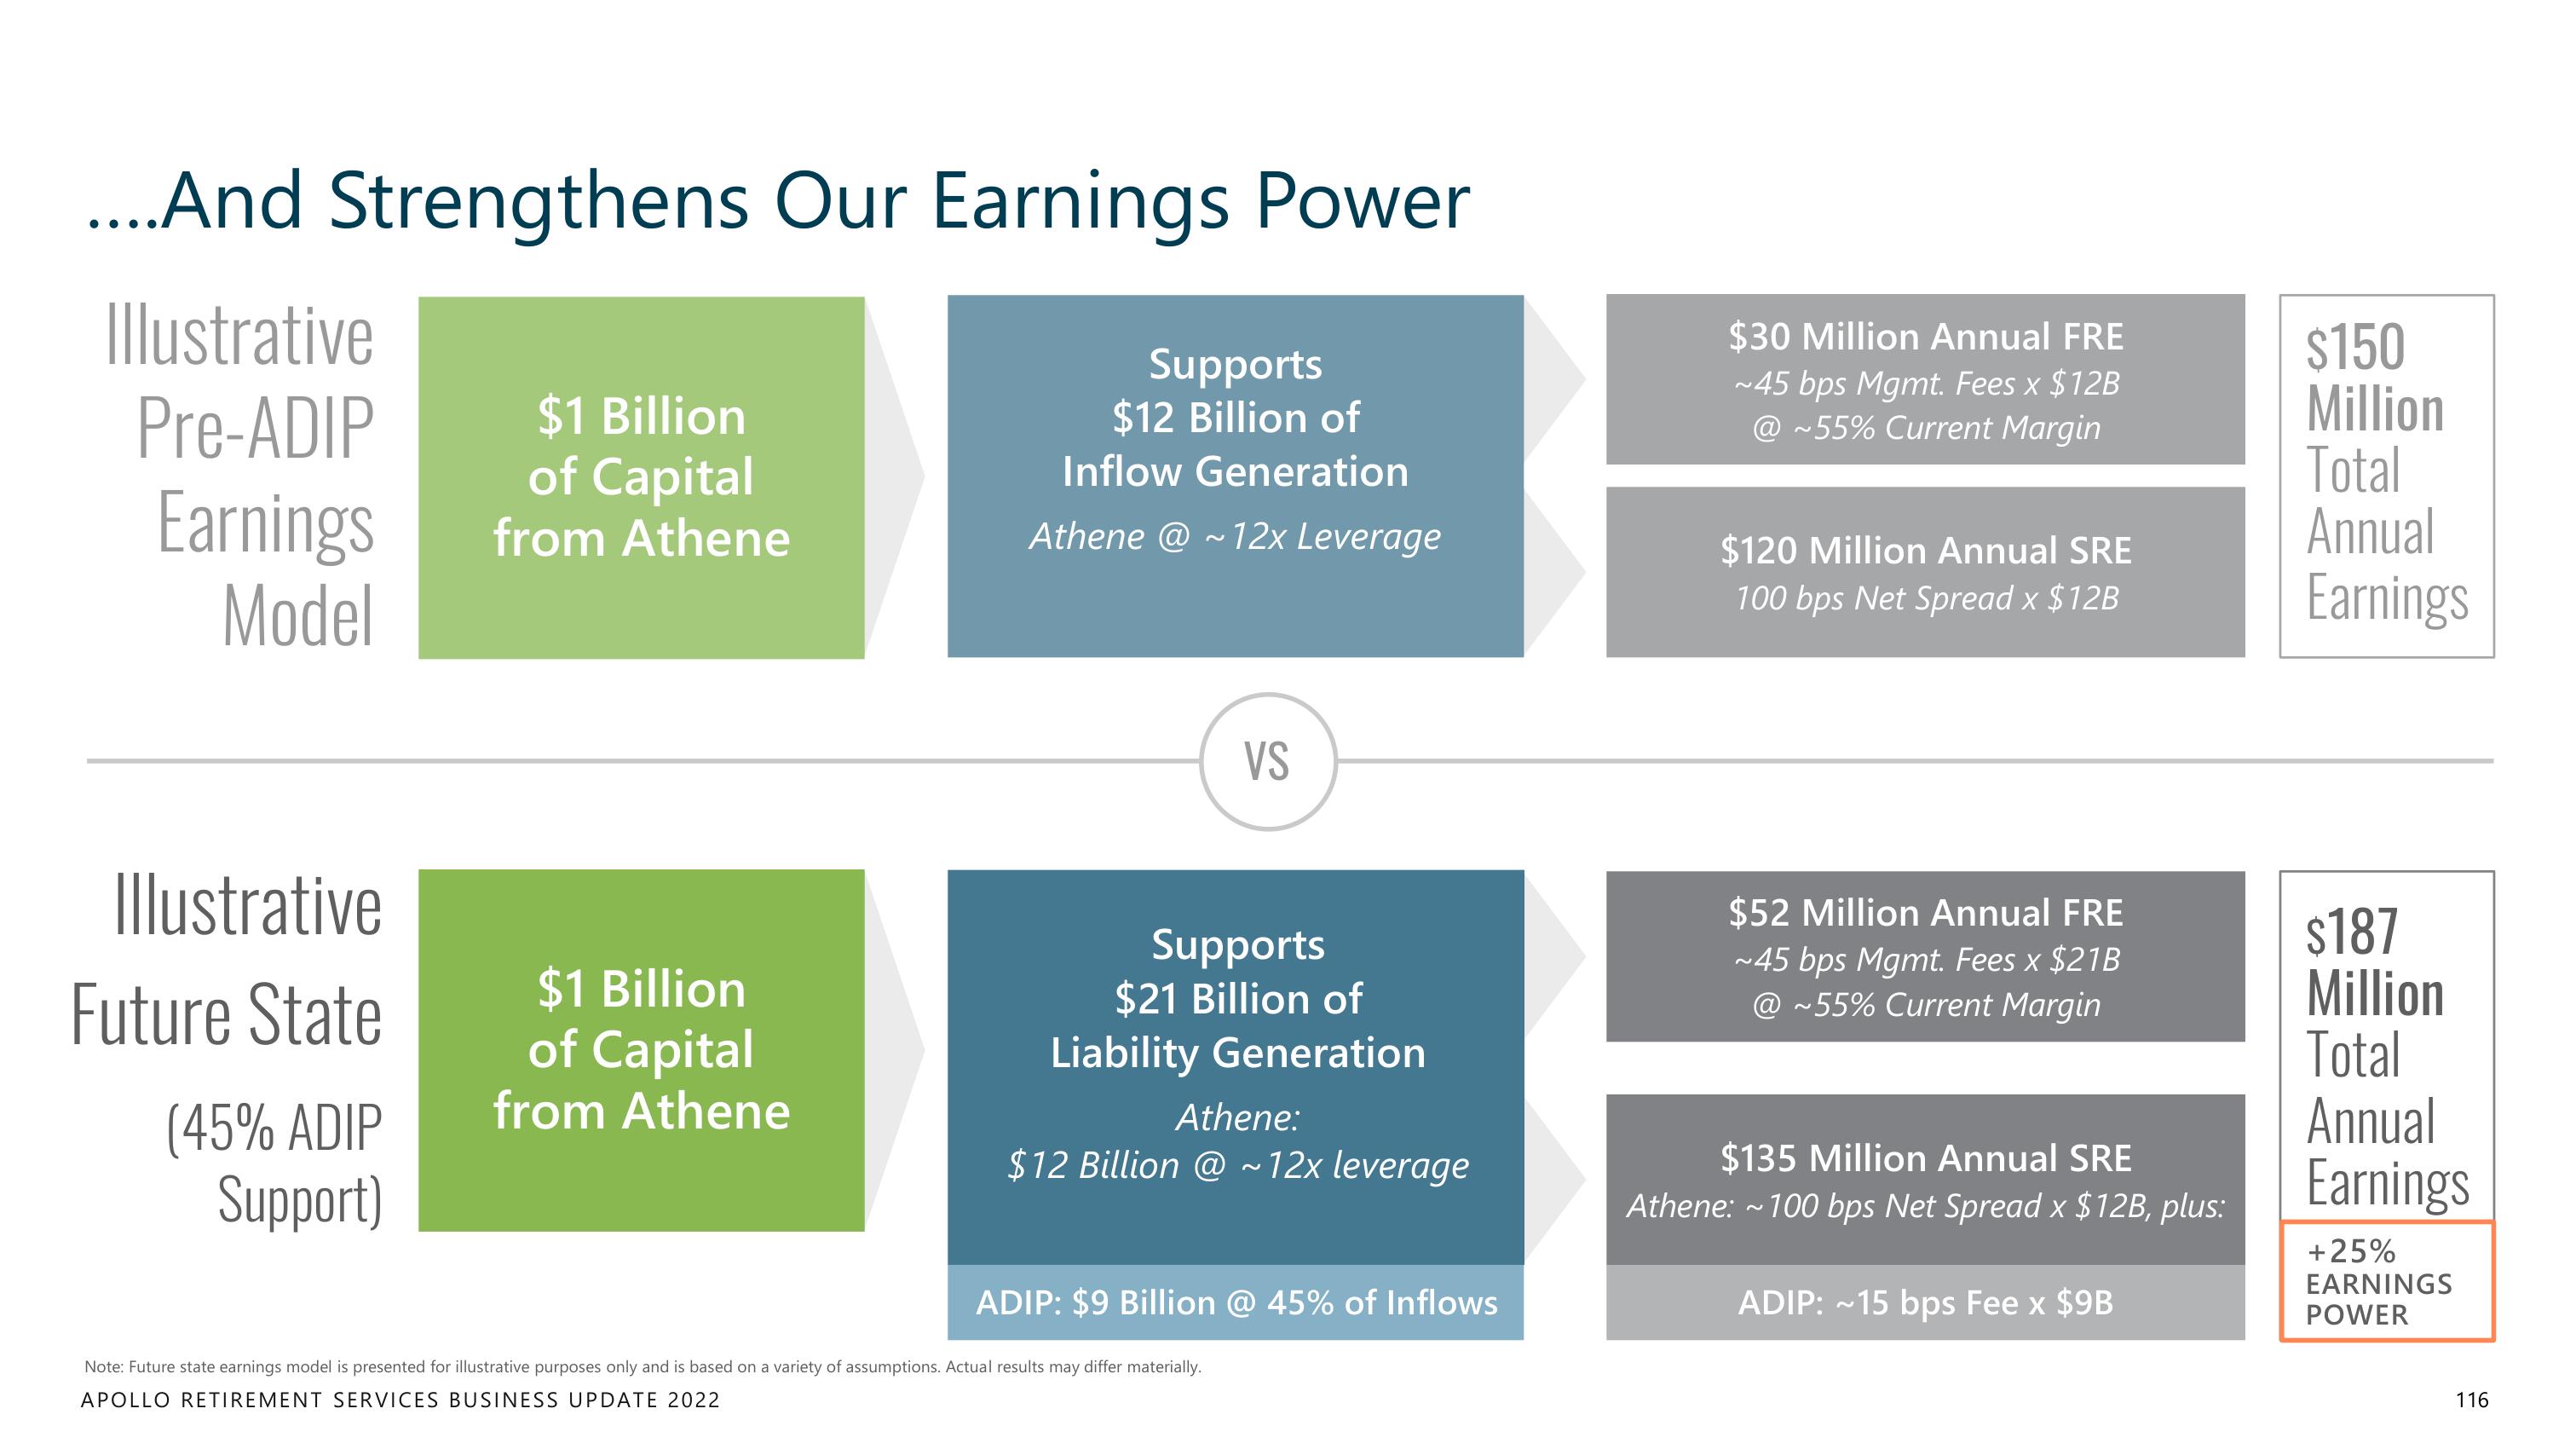
....And Strengthens Our Earnings Power
Illustrative
Pre-ADIP
Earnings
Model
Illustrative
Future State
(45% ADIP
Support)
$1 Billion
of Capital
from Athene
$1 Billion
of Capital
from Athene
Supports
$12 Billion of
Inflow Generation
Athene @~12x Leverage
VS
Supports
$21 Billion of
Liability Generation
Athene:
$12 Billion @ ~ 12x leverage
ADIP: $9 Billion @ 45% of Inflows
Note: Future state earnings model is presented for illustrative purposes only and is based on a variety of assumptions. Actual results may differ materially.
APOLLO RETIREMENT SERVICES BUSINESS UPDATE 2022
$30 Million Annual FRE
~45 bps Mgmt. Fees x $12B
@ ~55% Current Margin
$120 Million Annual SRE
100 bps Net Spread x $12B
$52 Million Annual FRE
~45 bps Mgmt. Fees x $21B
@ ~55% Current Margin
$135 Million Annual SRE
Athene: ~100 bps Net Spread x $12B, plus:
ADIP: ~15 bps Fee x $9B
$150
Million
Total
Annual
Earnings
$187
Million
Total
Annual
Earnings
+ 25%
EARNINGS
POWER
116View entire presentation