Dynatrace Results Presentation Deck
1)
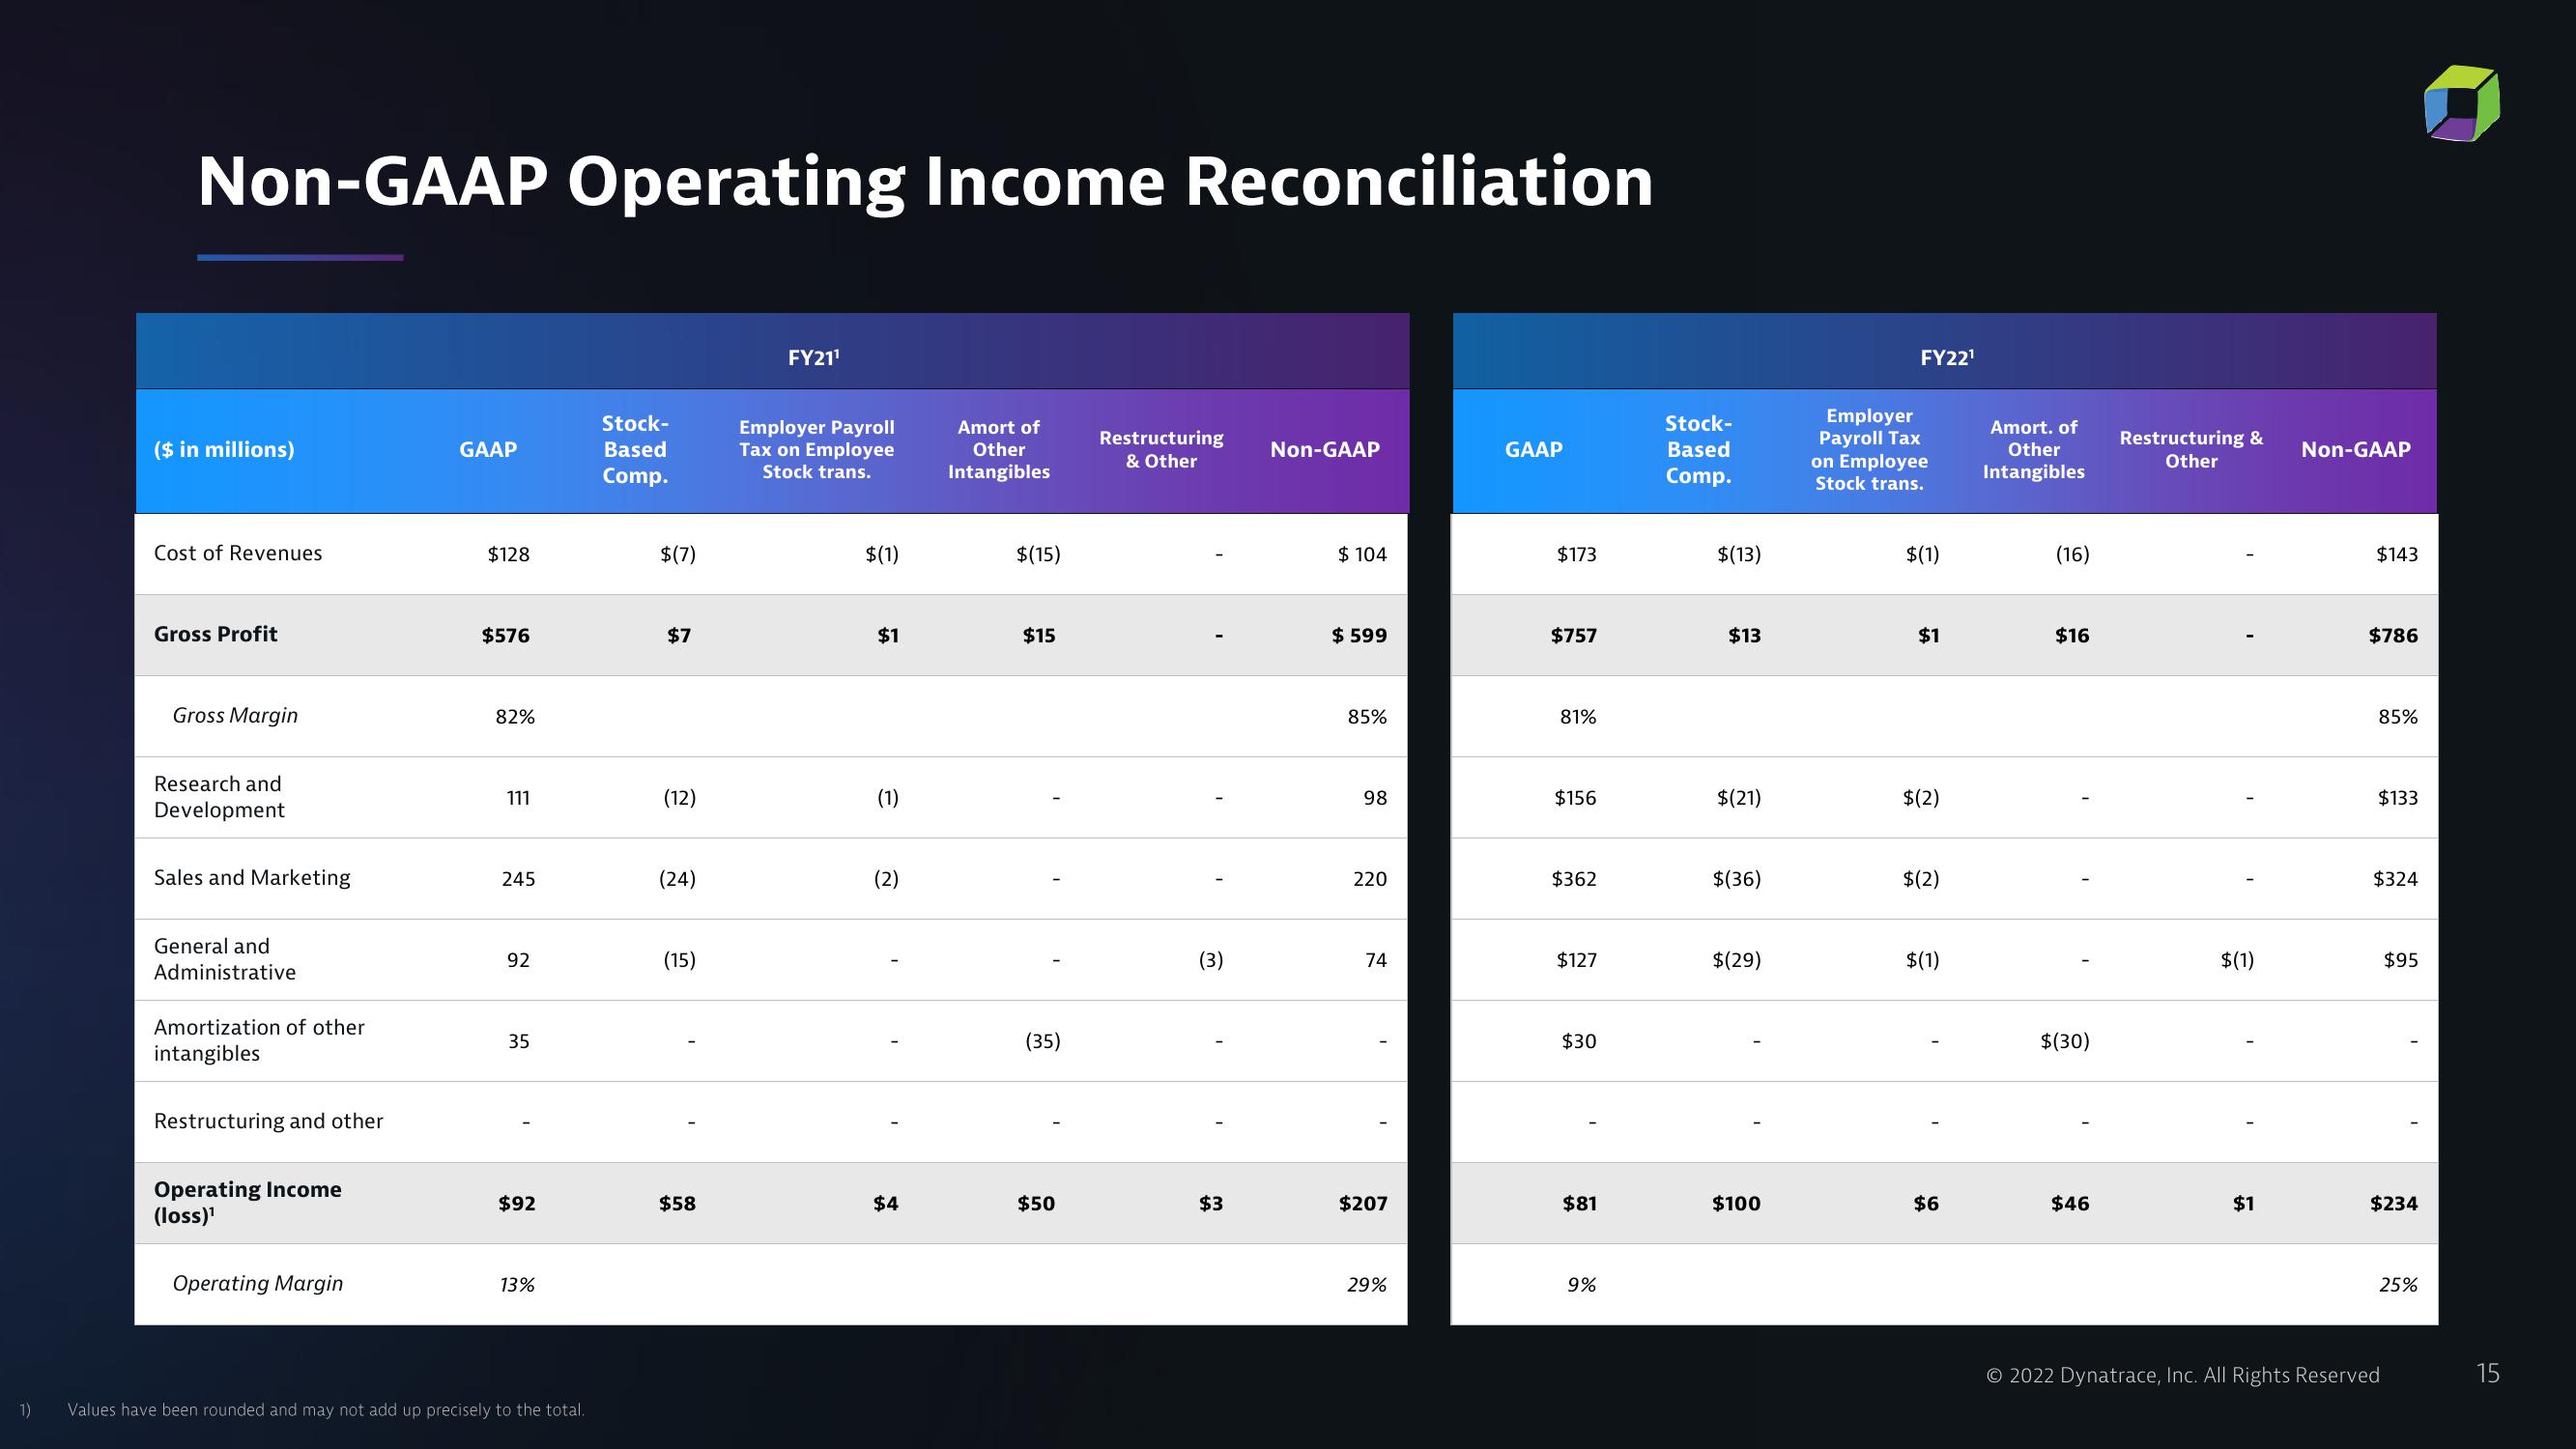
Non-GAAP Operating Income Reconciliation
($ in millions)
Cost of Revenues
Gross Profit
Gross Margin
Research and
Development
Sales and Marketing
General and
Administrative
Amortization of other
intangibles
Restructuring and other
Operating Income
(loss)¹
Operating Margin
GAAP
$128
$576
82%
111
245
92
35
$92
13%
Values have been rounded and may not add up precisely to the total.
Stock-
Based
Comp.
$(7)
$7
(12)
(24)
(15)
$58
FY21¹
Employer Payroll
Tax on Employee
Stock trans.
$(1)
$1
(1)
(2)
1
$4
Amort of
Other
Intangibles
$(15)
$15
(35)
$50
Restructuring
& Other
(3)
1
$3
Non-GAAP
$ 104
$ 599
85%
98
220
74
I
$207
29%
GAAP
$173
$757
81%
$156
$362
$127
$30
$81
9%
Stock-
Based
Comp.
$(13)
$13
$(21)
$(36)
$(29)
$100
FY22¹
Employer
Payroll Tax
on Employee
Stock trans.
$(1)
$1
$(2)
$(2)
$(1)
$6
Amort. of
Other
Intangibles
(16)
$16
$(30)
$46
Restructuring &
Other
$(1)
$1
Non-GAAP
$143
$786
85%
$133
$324
$95
$234
25%
© 2022 Dynatrace, Inc. All Rights ReservedView entire presentation