Bank of America Results Presentation Deck
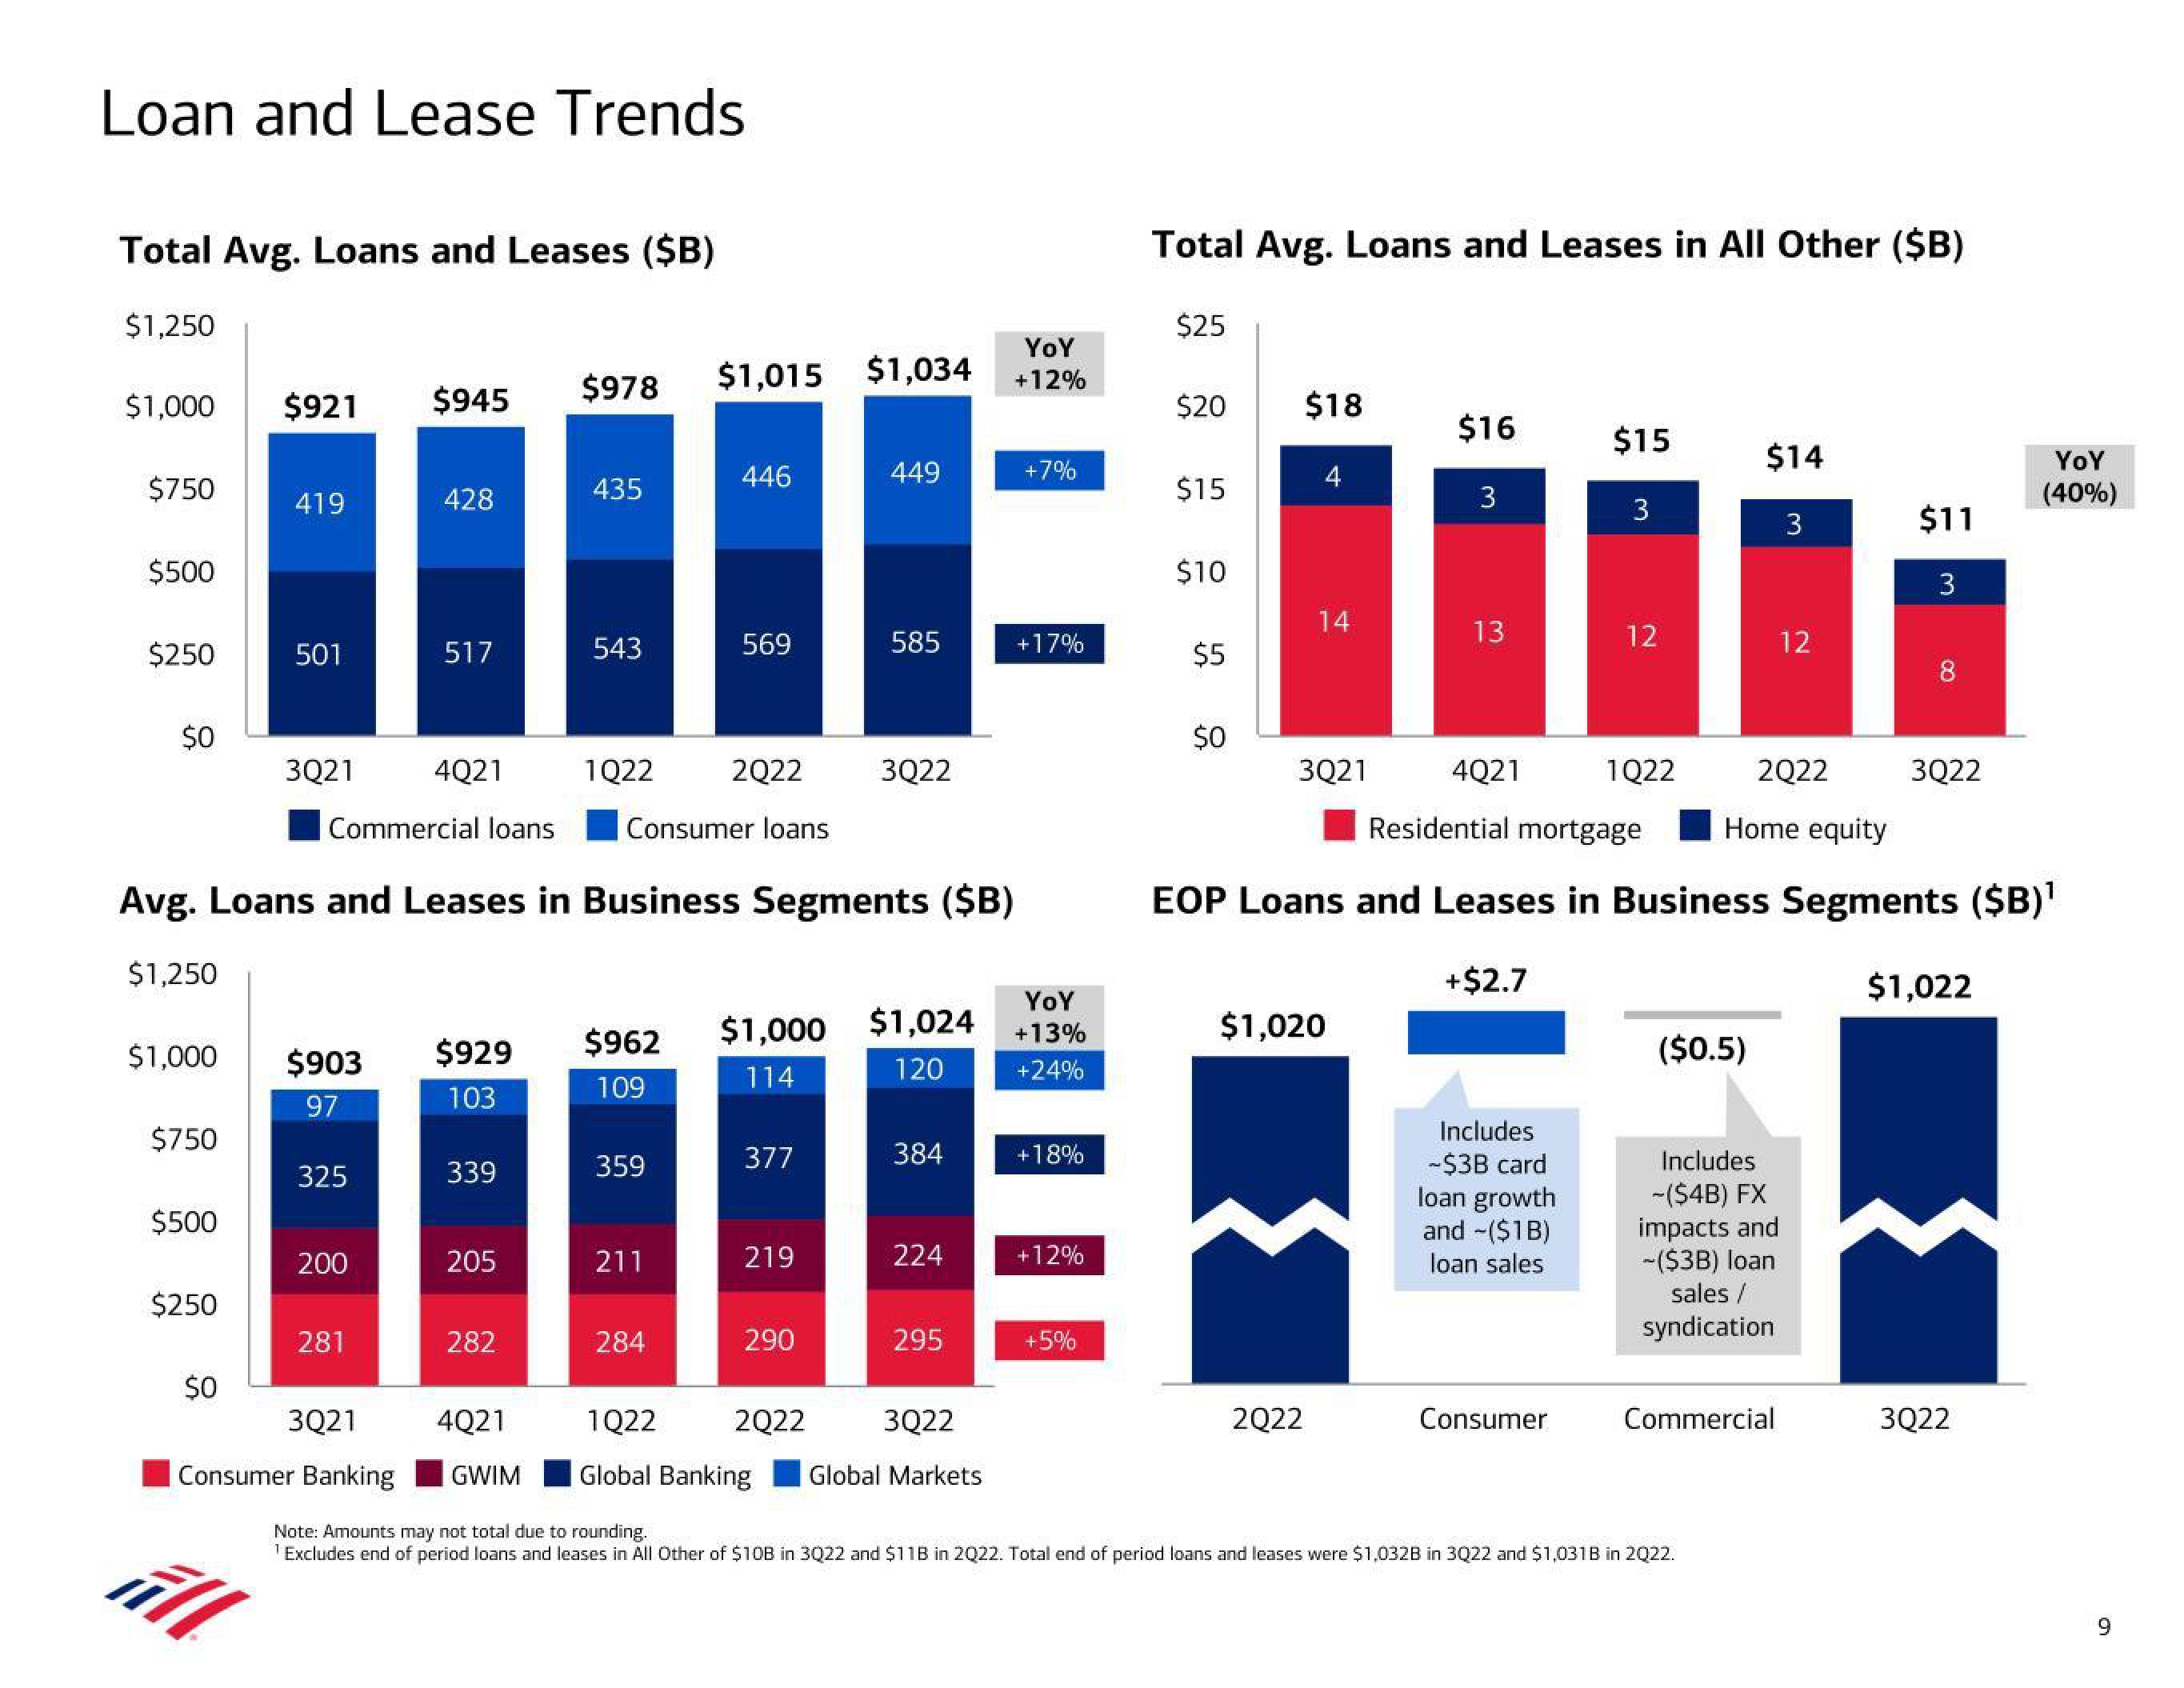
Loan and Lease Trends
Total Avg. Loans and Leases ($B)
$1,250
$1,000
$750
$500
$250
$0
$1,000
$750
$500
$250
$921 $945
$0
419
501
3Q21
428
325
517
200
4Q21
$903 $929
97
103
281
2Q22
Commercial loans Consumer loans
Avg. Loans and Leases in Business Segments ($B)
$1,250
339
205
282
$1,015 $1,034
$978
435
3Q21
4Q21
Consumer Banking GWIM
543
1Q22
$962
109
359
446
211
569
284
377
219
$1,000 $1,024
114
120
290
449
2Q22
585
1Q22
Global Banking
3Q22
384
224
YOY
+12%
295
3Q22
Global Markets
+7%
+17%
YOY
+13%
+24%
+18%
+12%
+5%
Total Avg. Loans and Leases in All Other ($B)
$25
$20
$15
$10
$5
$0
$18
4
14
3Q21
2Q22
$1,020
$16
3
13
4Q21
Includes
-$3B card
loan growth
and -($1B)
loan sales
$15
Consumer
3
12
2Q22
Residential mortgage
Home equity
EOP Loans and Leases in Business Segments ($B)¹
+$2.7
1Q22
($0.5)
$14
Includes
-($4B) FX
impacts and
-($3B) loan
sales /
syndication
Commercial
Note: Amounts may not total due to rounding.
¹Excludes end of period loans and leases in All Other of $10B in 3Q22 and $11B in 2Q22. Total end of period loans and leases were $1,032B in 3Q22 and $1,031B in 2Q22.
3
12
$11
3
8
3Q22
$1,022
YOY
(40%)
3Q22
9View entire presentation