Casper Investor Presentation Deck
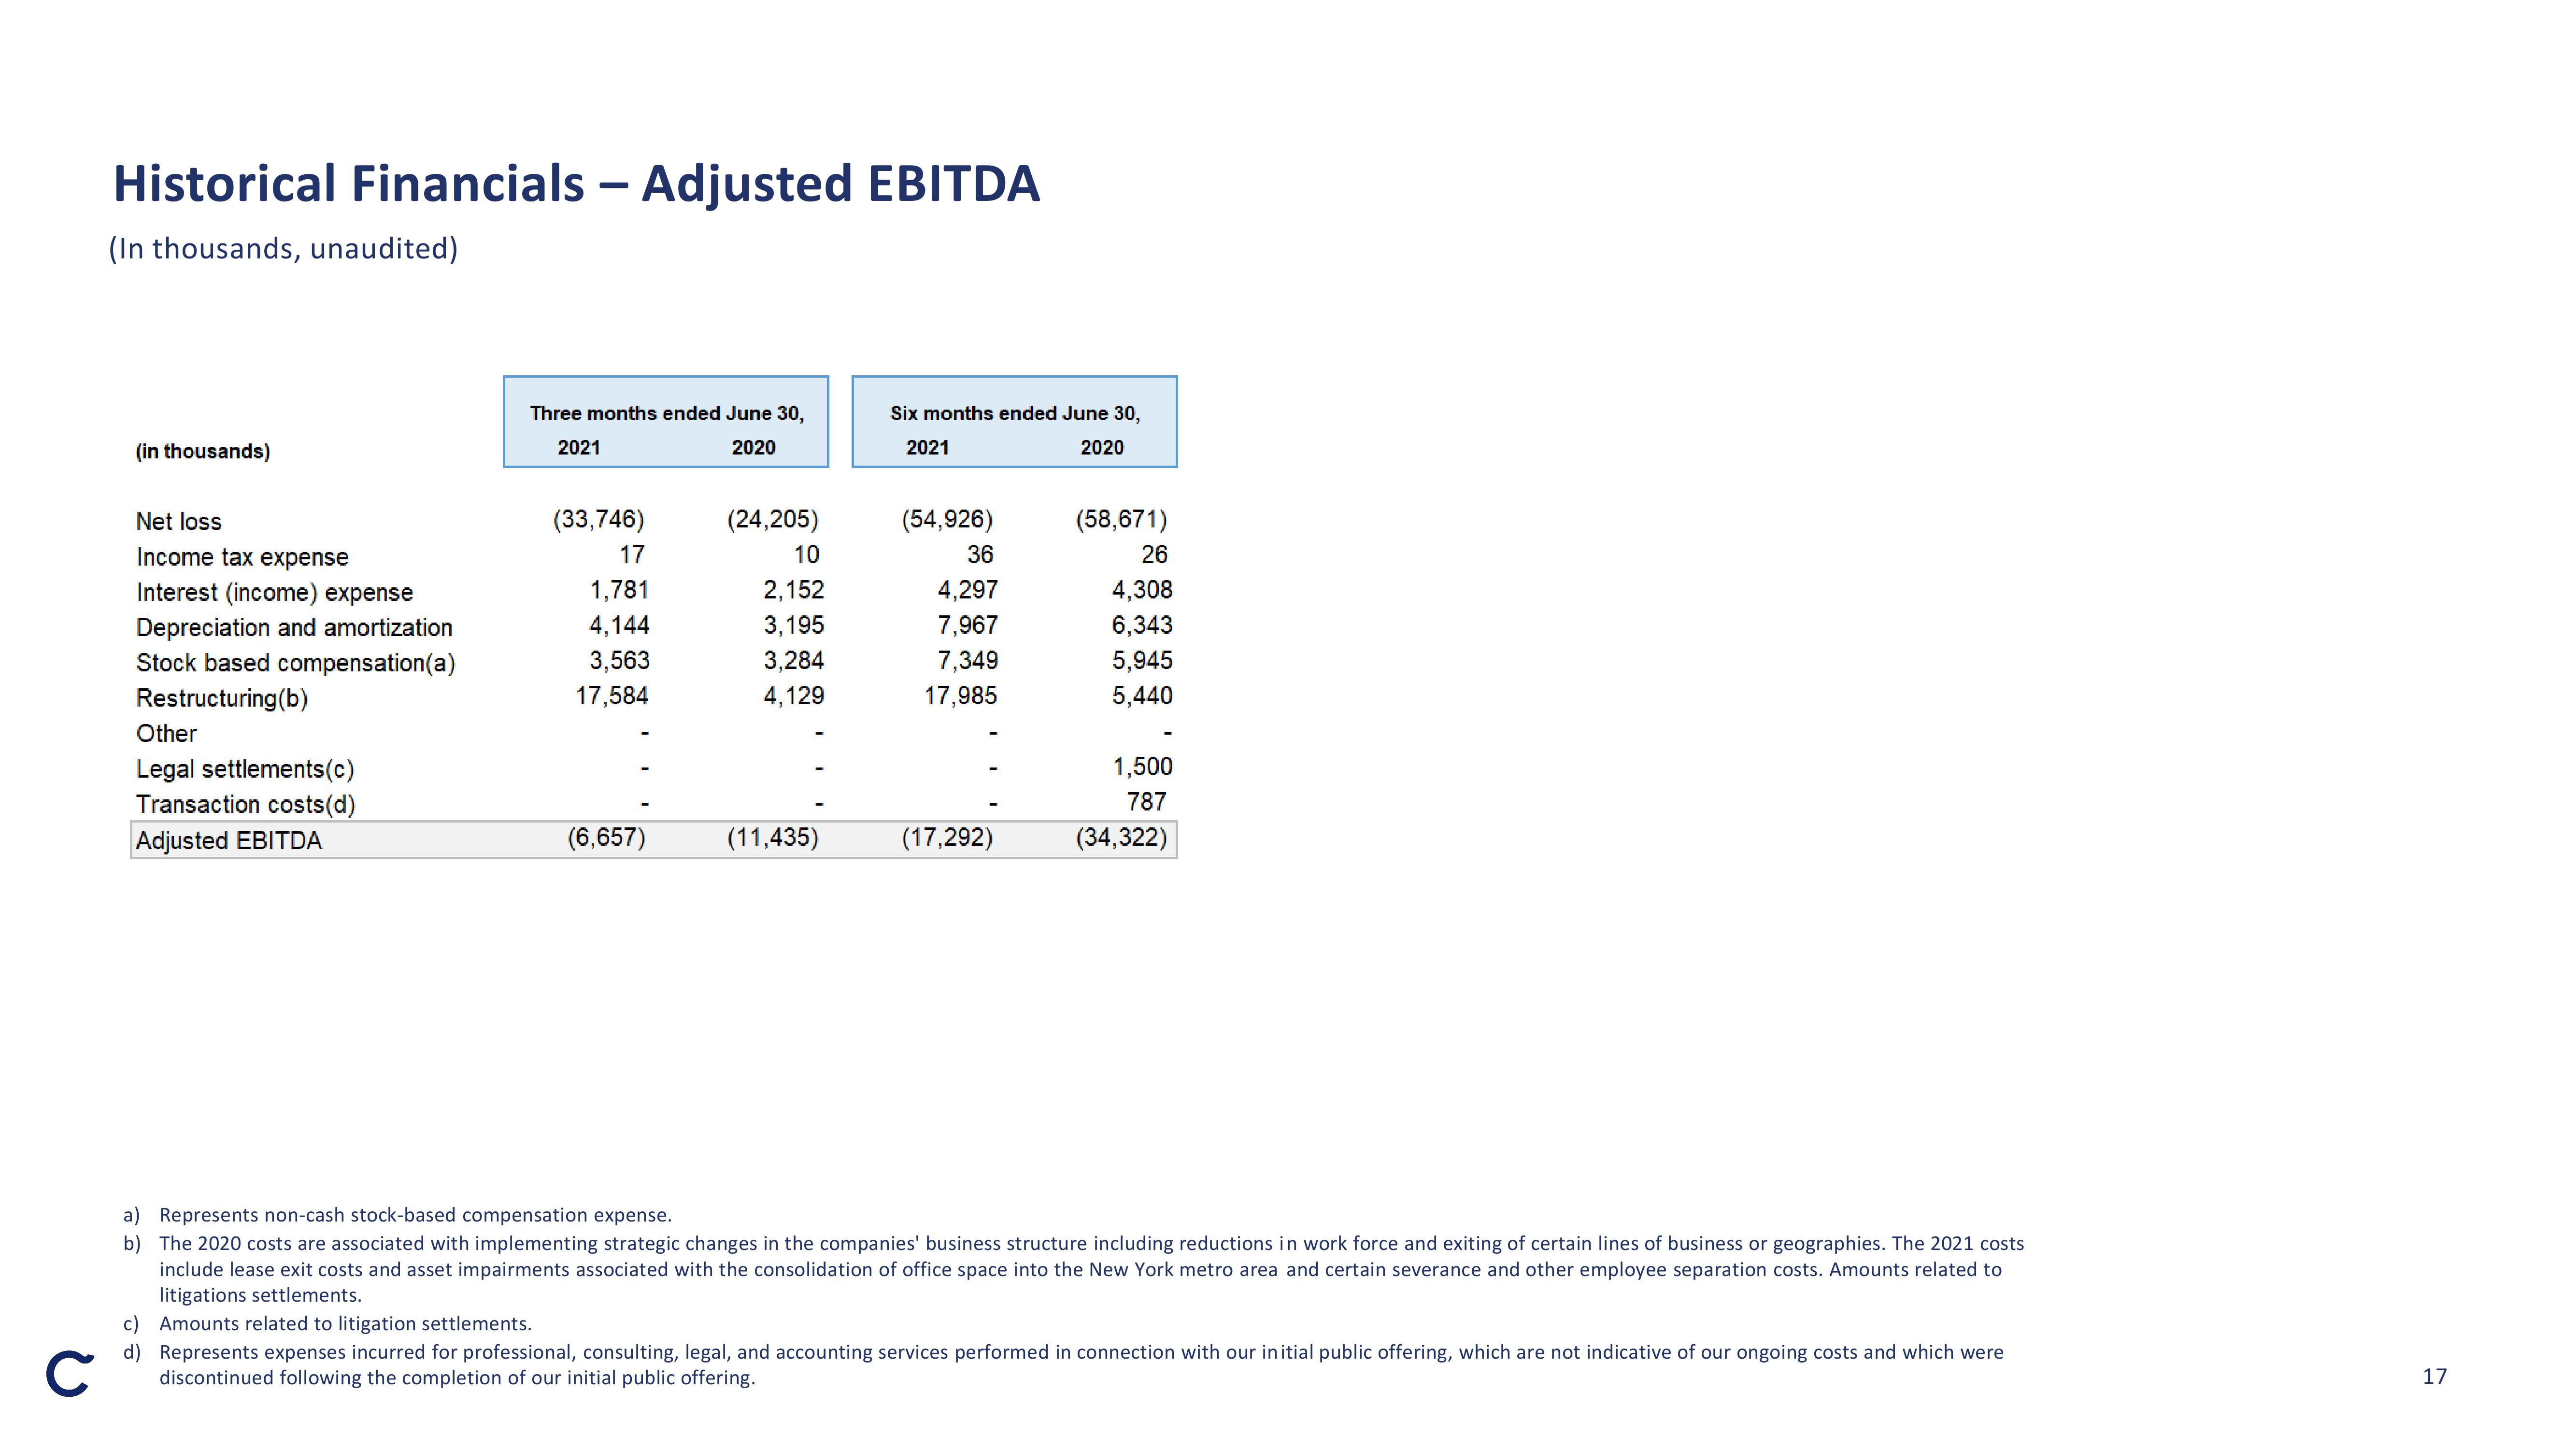
Historical Financials - Adjusted EBITDA
(In thousands, unaudited)
(in thousands)
Net loss
Income tax expense
Interest (income) expense
Depreciation and amortization
Stock based compensation(a)
Restructuring (b)
Other
Legal settlements (c)
Transaction costs(d)
Adjusted EBITDA
Three months ended June 30,
2021
2020
(33,746)
17
1,781
4,144
3,563
17,584
(6,657)
(24,205)
10
2,152
3,195
3,284
4,129
(11,435)
Six months ended June
2021
2020
(54,926)
36
4,297
7,967
7,349
17,985
(17,292)
(58,671)
26
4,308
6,343
5,945
5,440
1,500
787
(34,322)
a) Represents non-cash stock-based compensation expense.
b) The 2020 costs are associated with implementing strategic changes in the companies' business structure including reductions in work force and exiting of certain lines of business or geographies. The 2021 costs
include lease exit costs and asset impairments associated with the consolidation of office space into the New York metro area and certain severance and other employee separation costs. Amounts related to
litigations settlements.
c) Amounts related to litigation settlements.
C
d) Represents expenses incurred for professional, consulting, legal, and accounting services performed in connection with our initial public offering, which are not indicative of our ongoing costs and which were
discontinued following the completion of our initial public offering.
17View entire presentation