Apollo Global Management Investor Day Presentation Deck
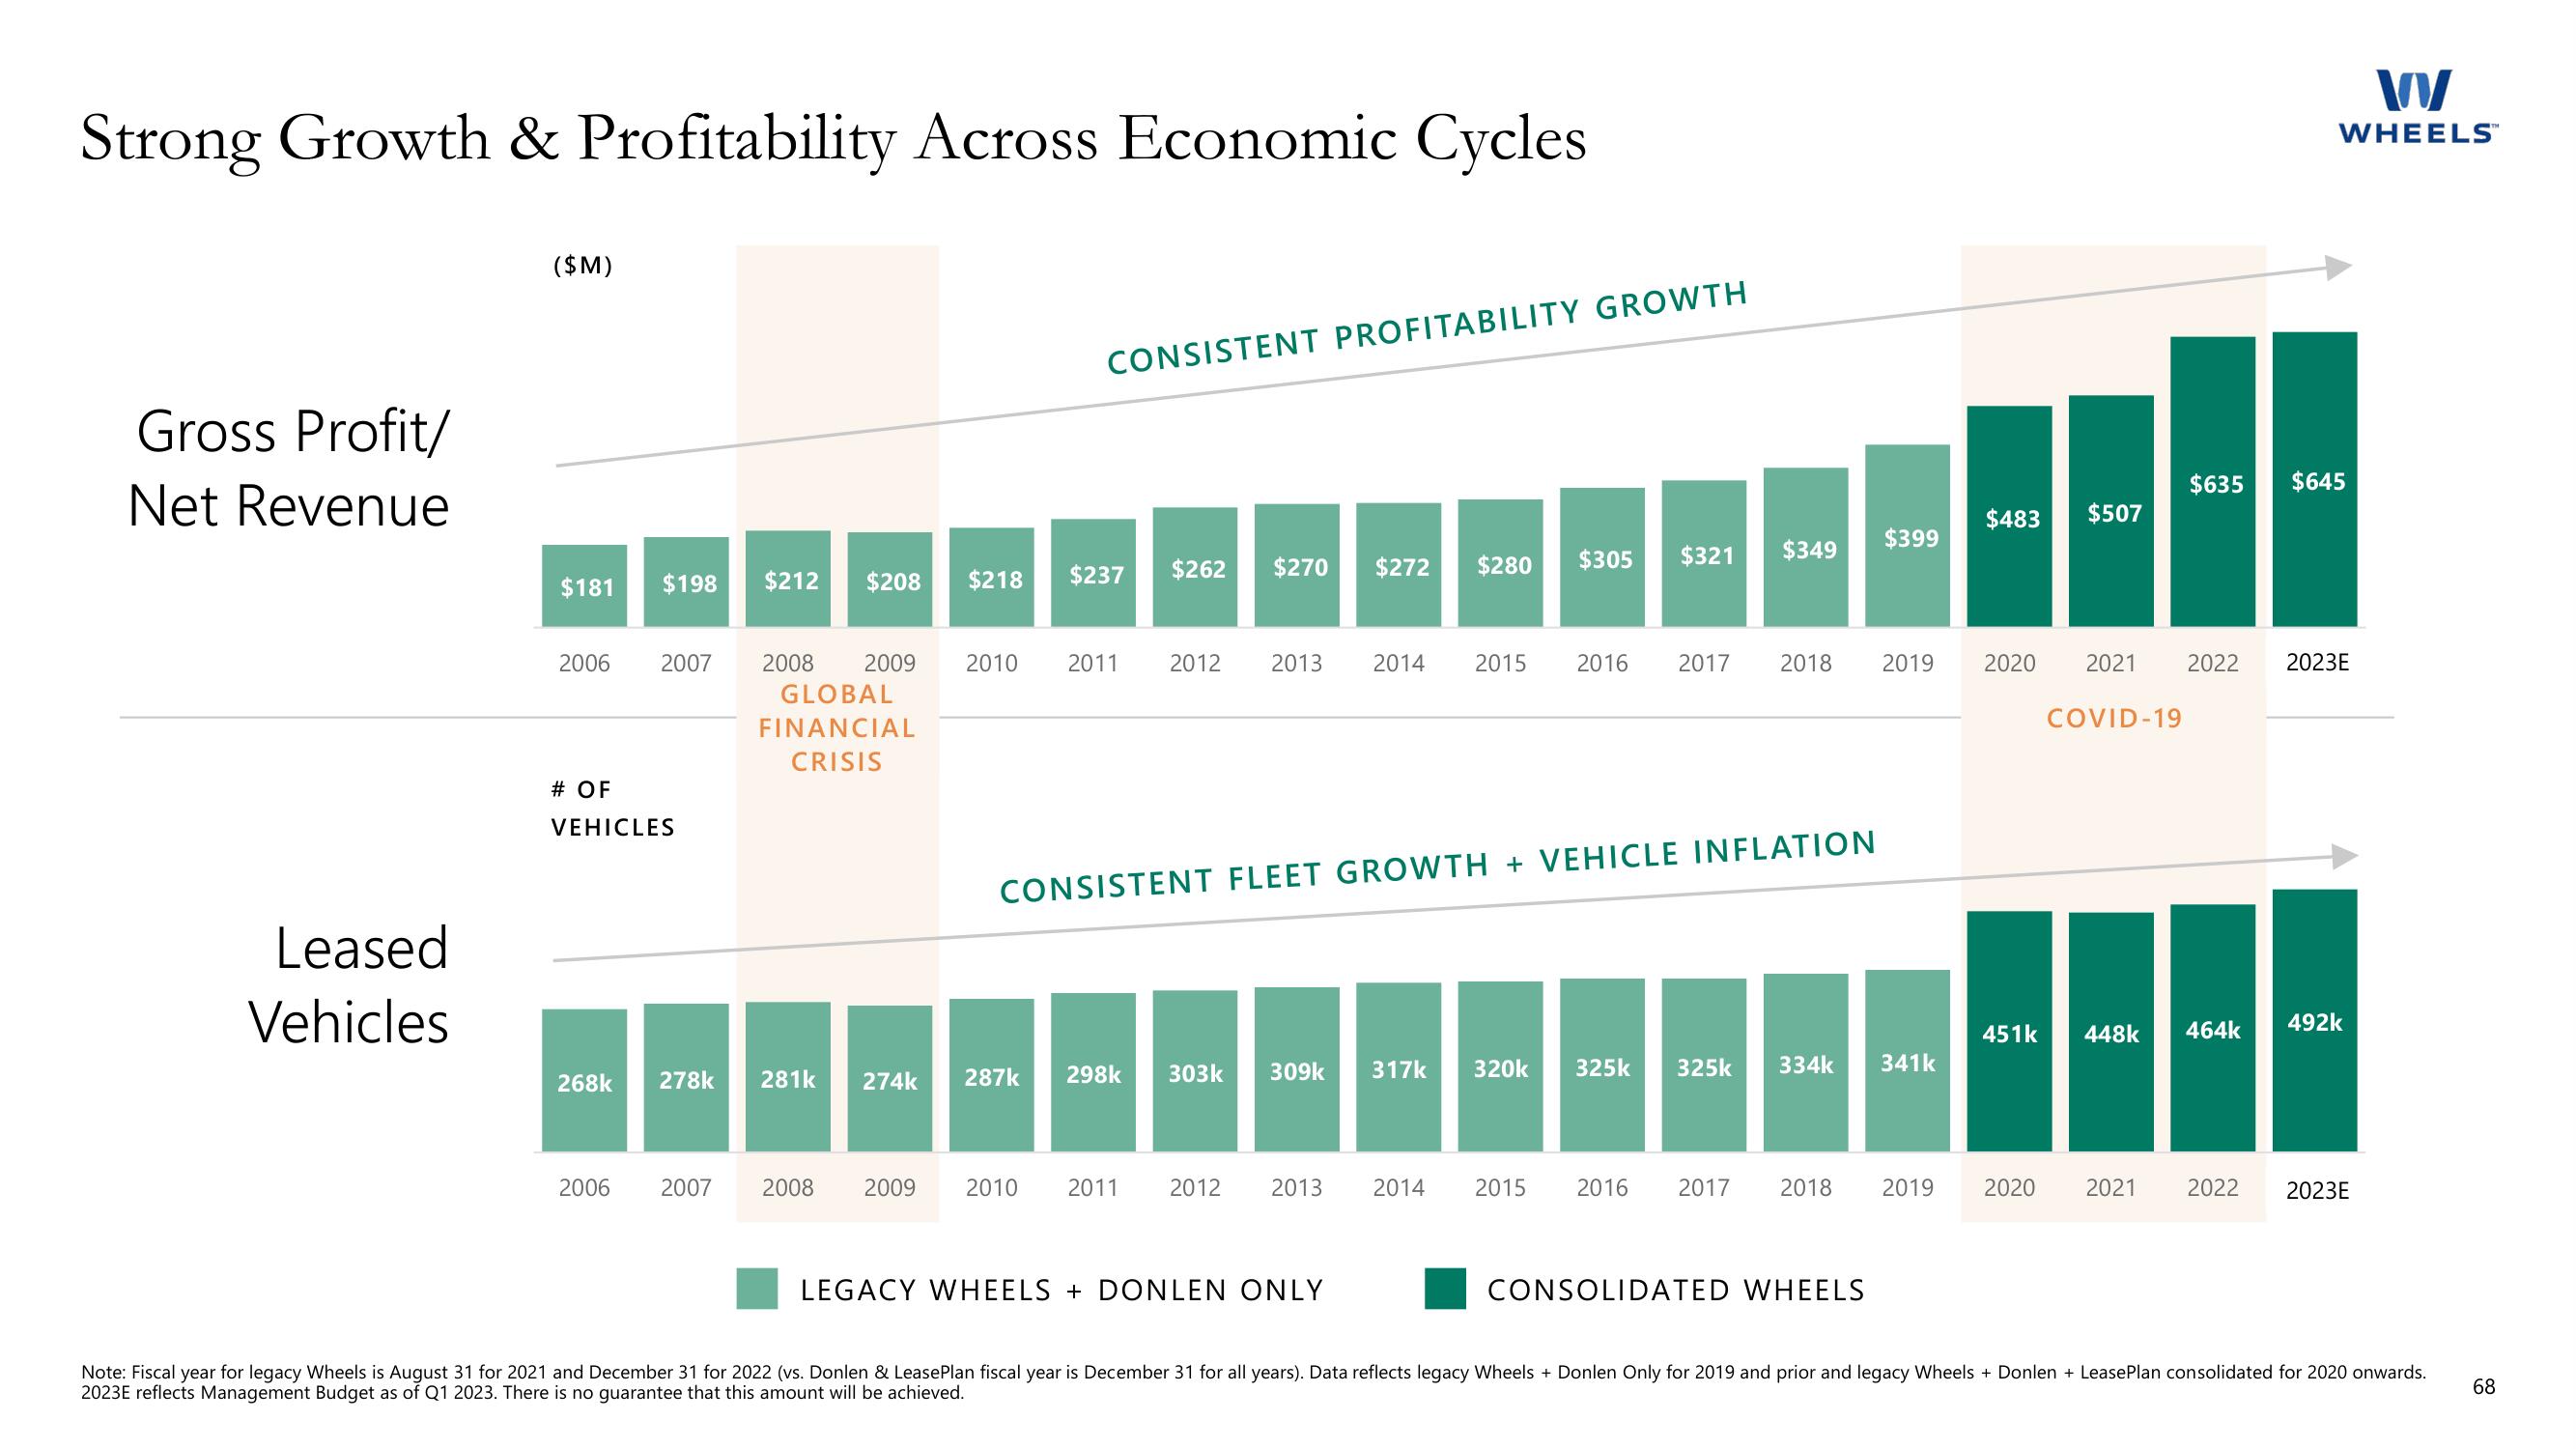
Strong Growth & Profitability Across Economic Cycles
Gross Profit/
Net Revenue
Leased
Vehicles
($M)
$181 $198
# OF
VEHICLES
$212 $208 $218
268k 278k
2006 2007 2008 2009 2010 2011
GLOBAL
FINANCIAL
CRISIS
281k
2006 2007 2008
274k
2009
CONSISTENT PROFITABILITY GROWTH
$237
287k
$262
$270 $272 $280 $305
2012 2013 2014 2015 2016 2017
298k 303k
CONSISTENT FLEET GROWTH + VEHICLE INFLATION
309k
2010 2011 2012 2013 2014
LEGACY WHEELS + DONLEN ONLY
$321 $349
320k
317k
325k
2018
334k
325k
2015 2016 2017
$399
CONSOLIDATED WHEELS
$483
341k
451k
2018 2019 2020
$507
2019 2020 2021 2022 2023E
COVID-19
448k
W
WHEELS™
$635 $645
464k
492k
2021 2022 2023E
Note: Fiscal year for legacy Wheels is August 31 for 2021 and December 31 for 2022 (vs. Donlen & LeasePlan fiscal year is December 31 for all years). Data reflects legacy Wheels + Donlen Only for 2019 and prior and legacy Wheels+ Donlen + LeasePlan consolidated for 2020 onwards.
2023E reflects Management Budget as of Q1 2023. There is no guarantee that this amount will be achieved.
68View entire presentation