WeWork Investor Presentation Deck
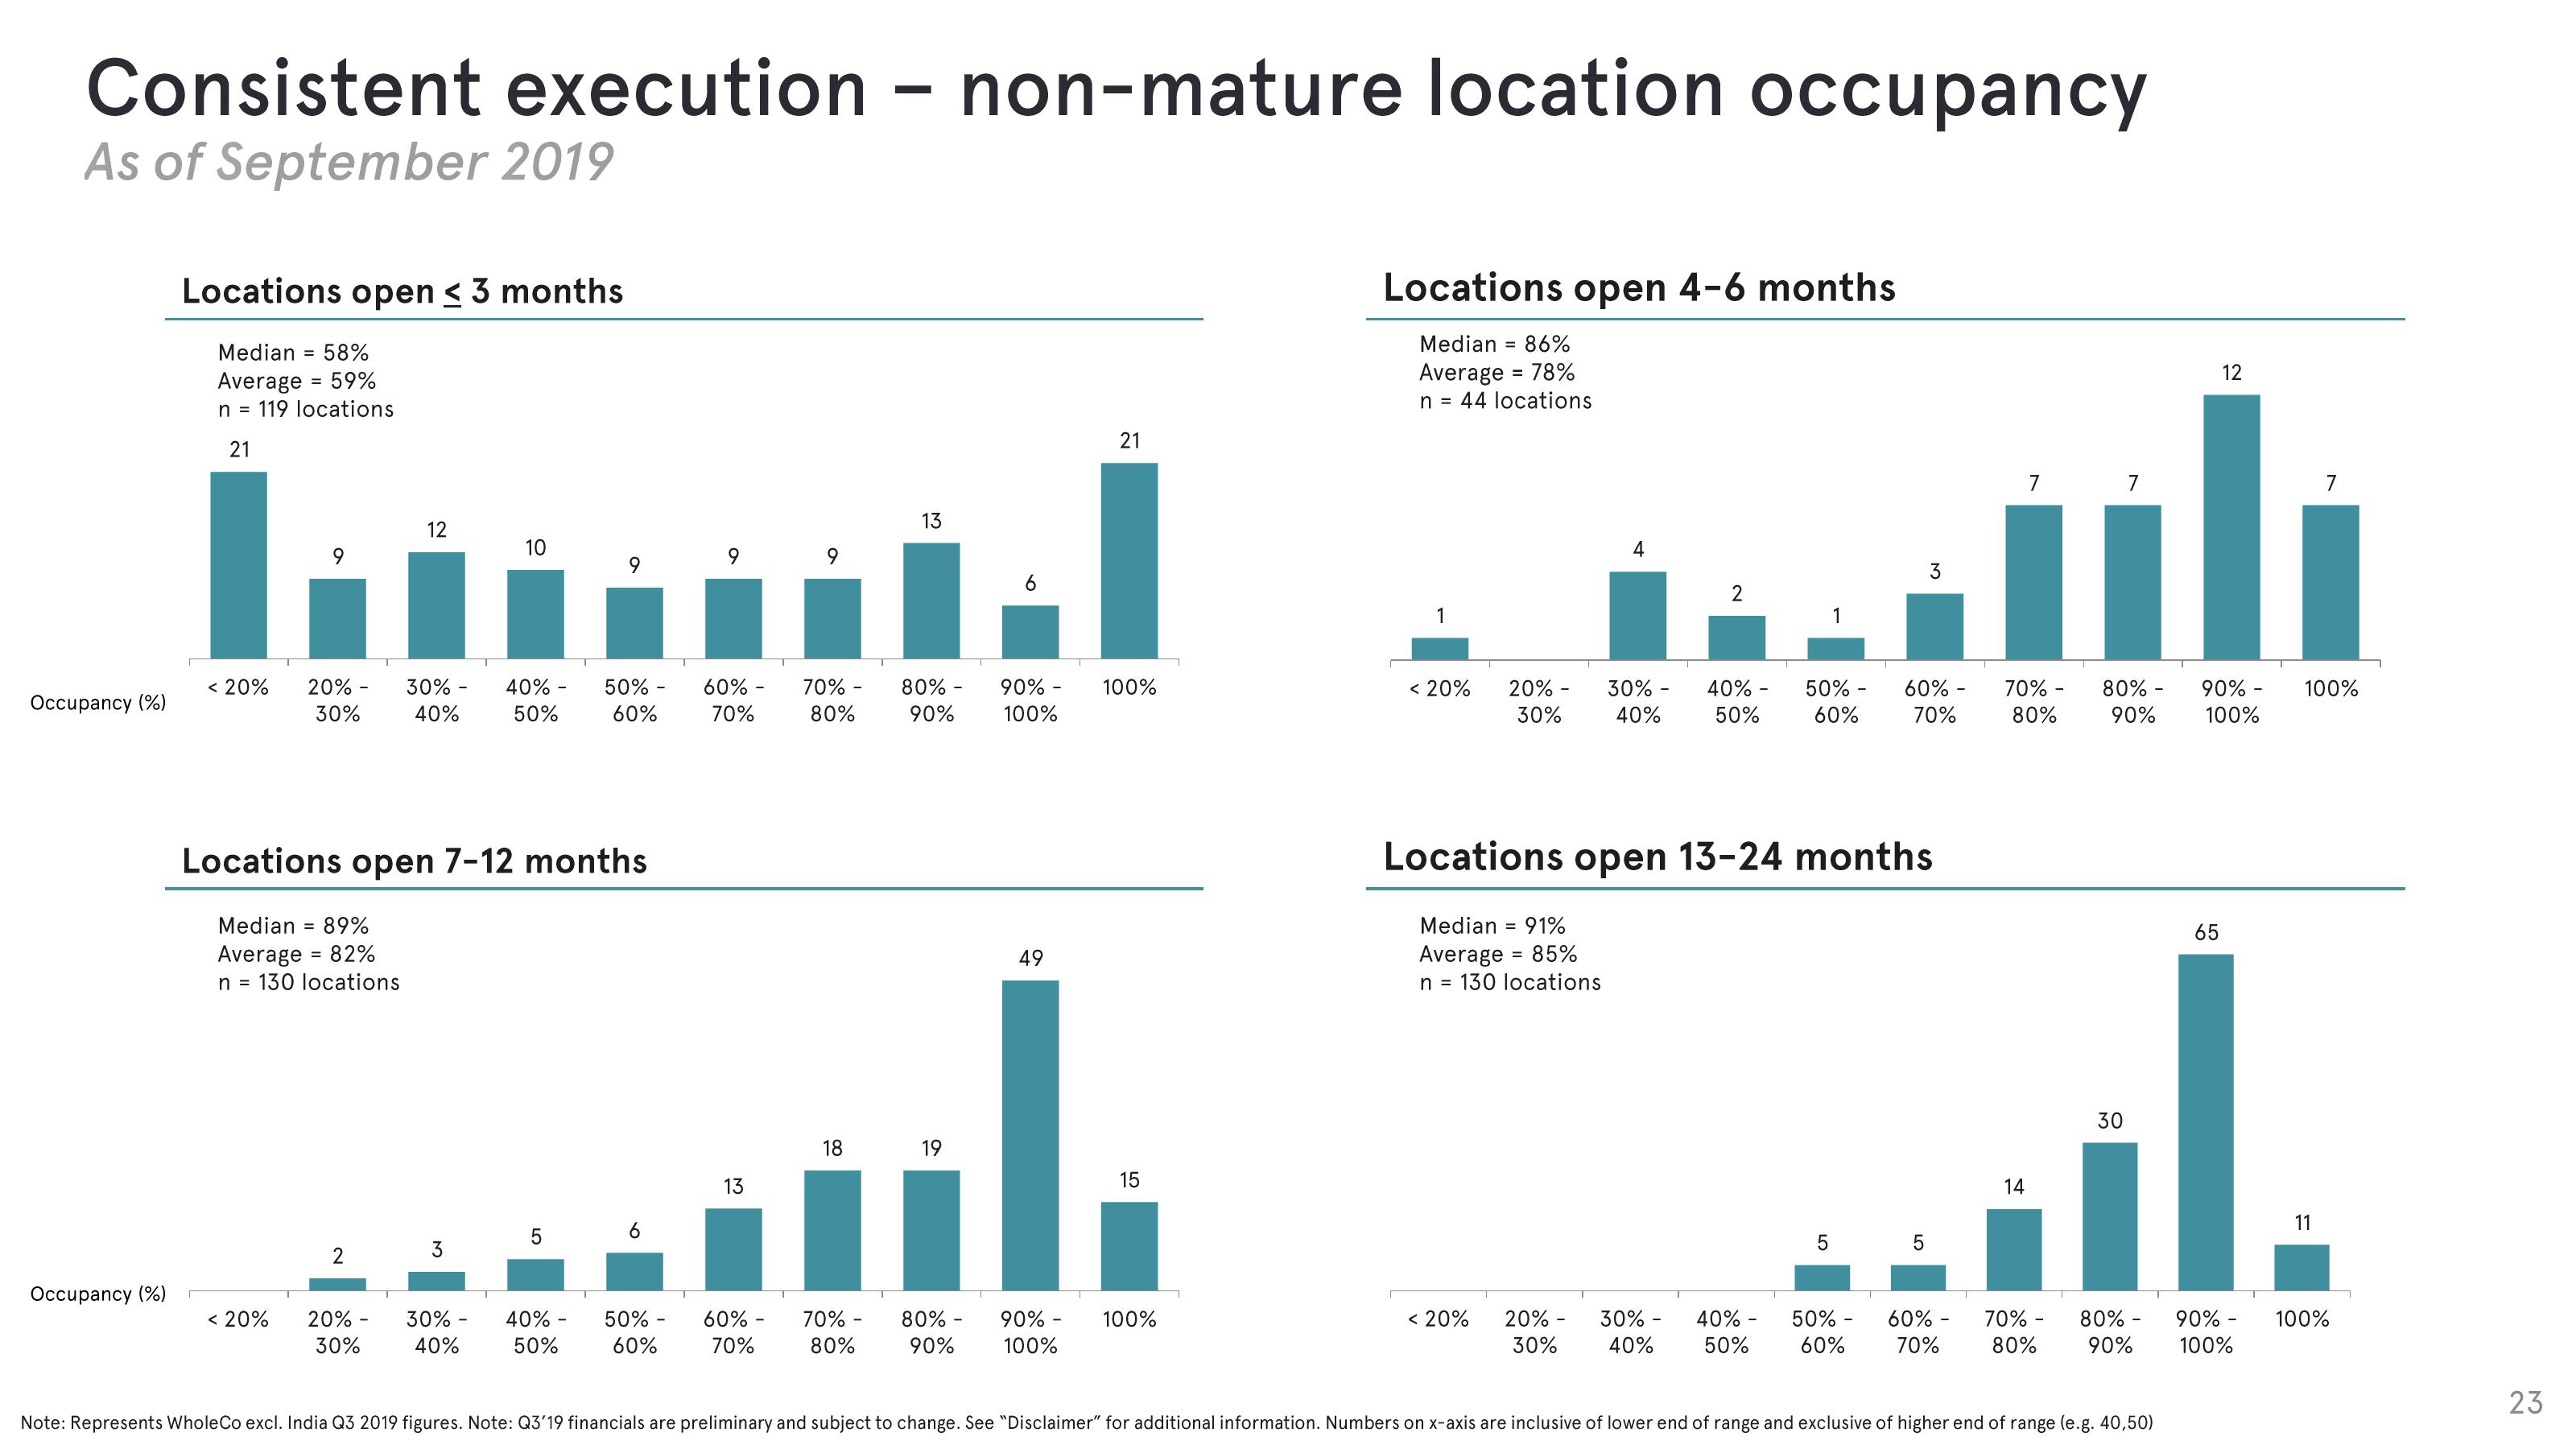
Consistent execution - non-mature location occupancy
As of September 2019
Occupancy (%)
Occupancy (%)
Locations open ≤ 3 months
Median 58%
Average = 59%
n = 119 locations
21
< 20%
=
< 20%
9
20% - 30%
30% 40%
12
2
20%
30%
Locations open 7-12 months
Median = 89%
Average = 82%
n = 130 locations
3
10
30%
40%
40% -
50%
LO
5
9
40% -
50%
50% -
60%
50%
60%
9
60% -
70%
13
60%
70%
-
70% -
80%
13
70%
80%
80%
90%
90% 100%
18 19
80% -
90%
49
90%-
100%
21
100%
15
100%
Locations open 4-6 months
Median = 86%
Average = 78%
n = 44 locations
1
< 20%
20% -
30%
Median = 91%
Average = 85%
n = 130 locations
< 20%
4
20%-
30%
30% -
40%
2
30% -
40%
40% -
50%
Locations open 13-24 months
40%
50%
1
50% -
60%
5
50%
60%
3
60% -
70%
5
60%
70%
12
7
7
nh
70% -
80%
14
70% -
80%
80%
90%
30
ان
80%
90%
90% -
100%
Note: Represents Whole Co excl. India Q3 2019 figures. Note: Q3'19 financials are preliminary and subject to change. See "Disclaimer" for additional information. Numbers on x-axis are inclusive of lower end of range and exclusive of higher end of range (e.g. 40,50)
65
90%-
100%
7
100%
11
100%
23View entire presentation