SmileDirectClub Results Presentation Deck
Marketing & selling.
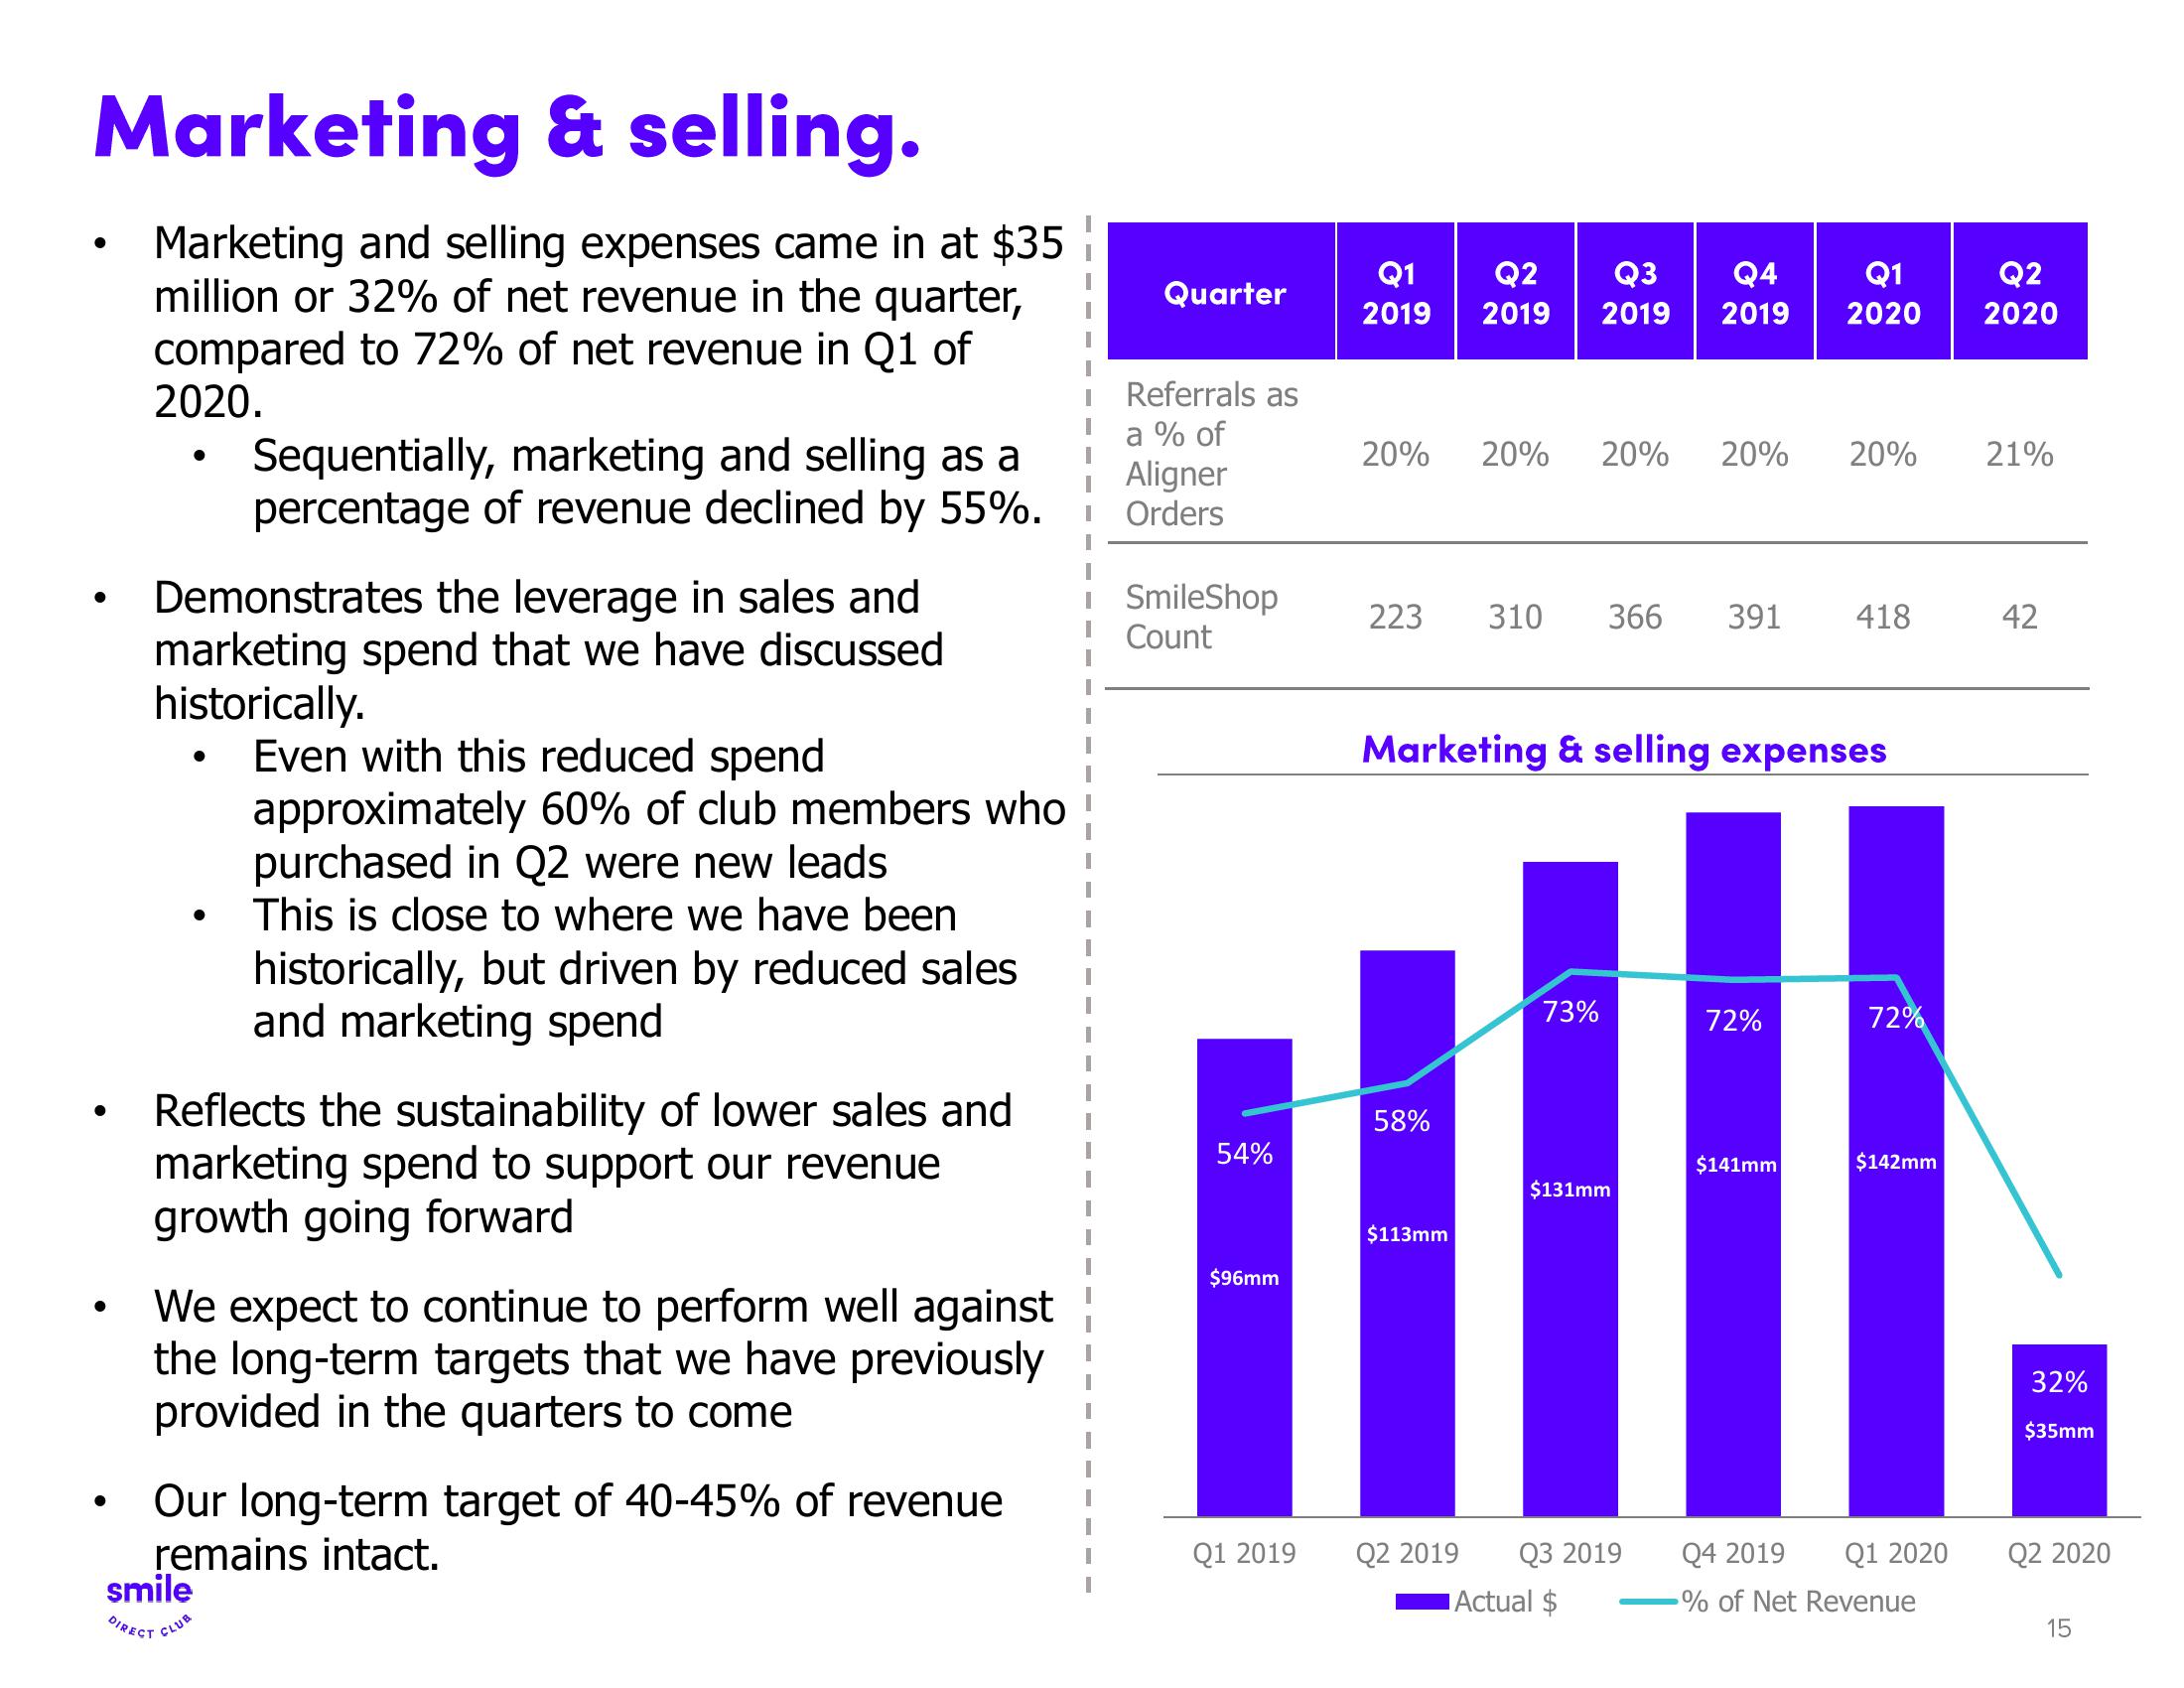
Marketing and selling expenses came in at $35
million or 32% of net revenue in the quarter,
compared to 72% of net revenue in Q1 of
2020.
●
●
●
●
Demonstrates the leverage in sales and
marketing spend that we have discussed
historically.
●
Sequentially, marketing and selling as a
percentage of revenue declined by 55%.
Reflects the sustainability of lower sales and
marketing spend to support our revenue
growth going forward
Even with this reduced spend
approximately 60% of club members who
purchased in Q2 were new leads
This is close to where we have been
historically, but driven by reduced sales
and marketing spend
We expect to continue to perform well against
the long-term targets that we have previously
provided in the quarters to come
smile
DIRECT
CLUB
Our long-term target of 40-45% of revenue
remains intact.
Quarter
Referrals as
a % of
Aligner
Orders
SmileShop
Count
54%
$96mm
Q1 2019
Q1 Q2 Q3 Q4
2019 2019 2019 2019
20%
223 310 366 391 418
58%
Marketing & selling expenses
$113mm
20% 20% 20% 20%
Q2 2019
73%
$131mm
Q3 2019
Actual $
Q1
2020
72%
$141mm
72%
$142mm
Q4 2019 Q1 2020
-% of Net Revenue
Q2
2020
21%
42
32%
$35mm
Q2 2020
15View entire presentation