Sonos Results Presentation Deck slide image

Sonos Results Presentation Deck

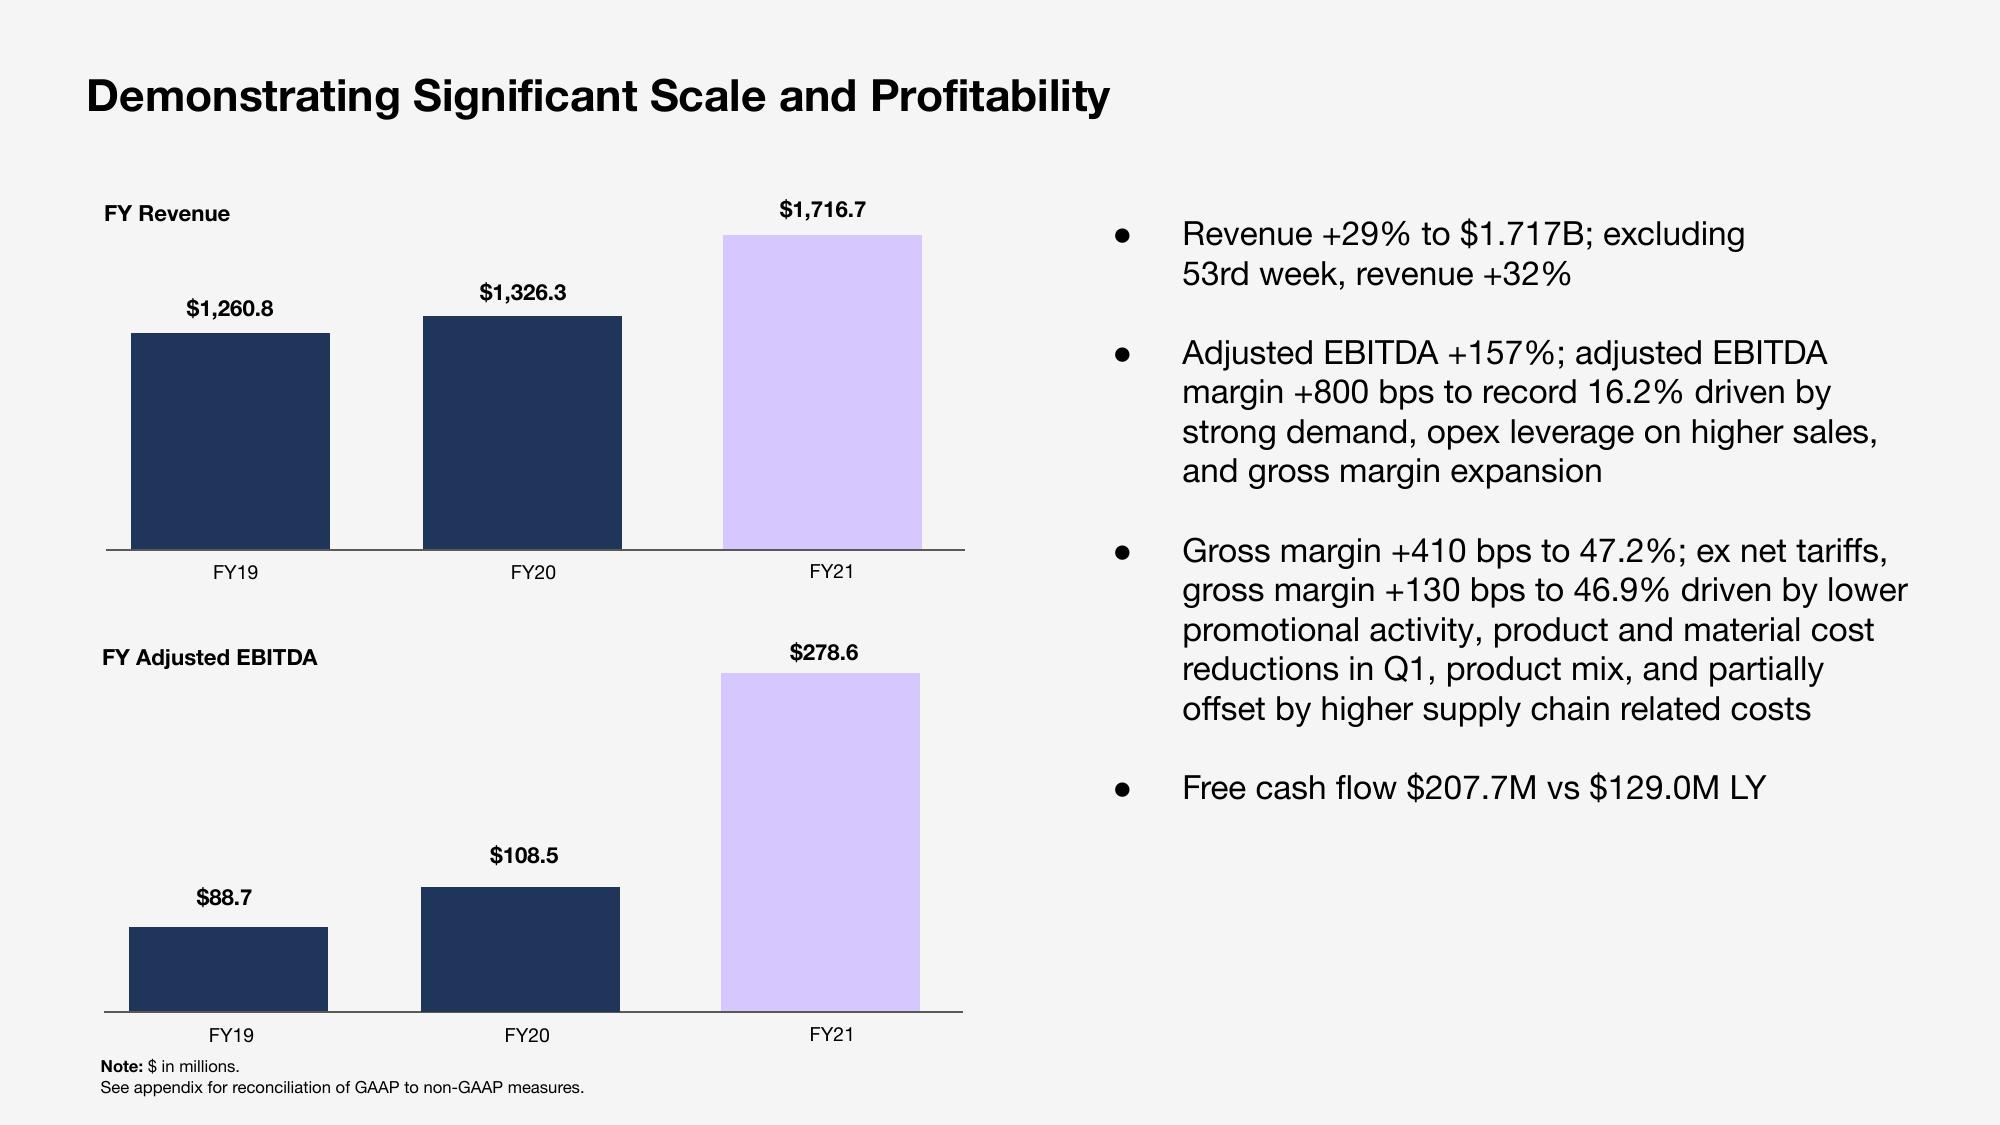
Demonstrating Significant Scale and Profitability FY Revenue $1,260.8 FY19 FY Adjusted EBITDA $88.7 $1,326.3 FY20 $108.5 FY19 Note: $ in millions. See appendix for reconciliation of GAAP to non-GAAP measures. FY20 $1,716.7 FY21 $278.6 FY21 Revenue +29% to $1.717B; excluding 53rd week, revenue +32% Adjusted EBITDA +157%; adjusted EBITDA margin +800 bps to record 16.2% driven by strong demand, opex leverage on higher sales, and gross margin expansion Gross margin +410 bps to 47.2%; ex net tariffs, gross margin +130 bps to 46.9% driven by lower promotional activity, product and material cost reductions in Q1, product mix, and partially offset by higher supply chain related costs Free cash flow $207.7M vs $129.0M LY
View entire presentation