Maersk Investor Presentation Deck
Financial highlights
Consolidated financial information
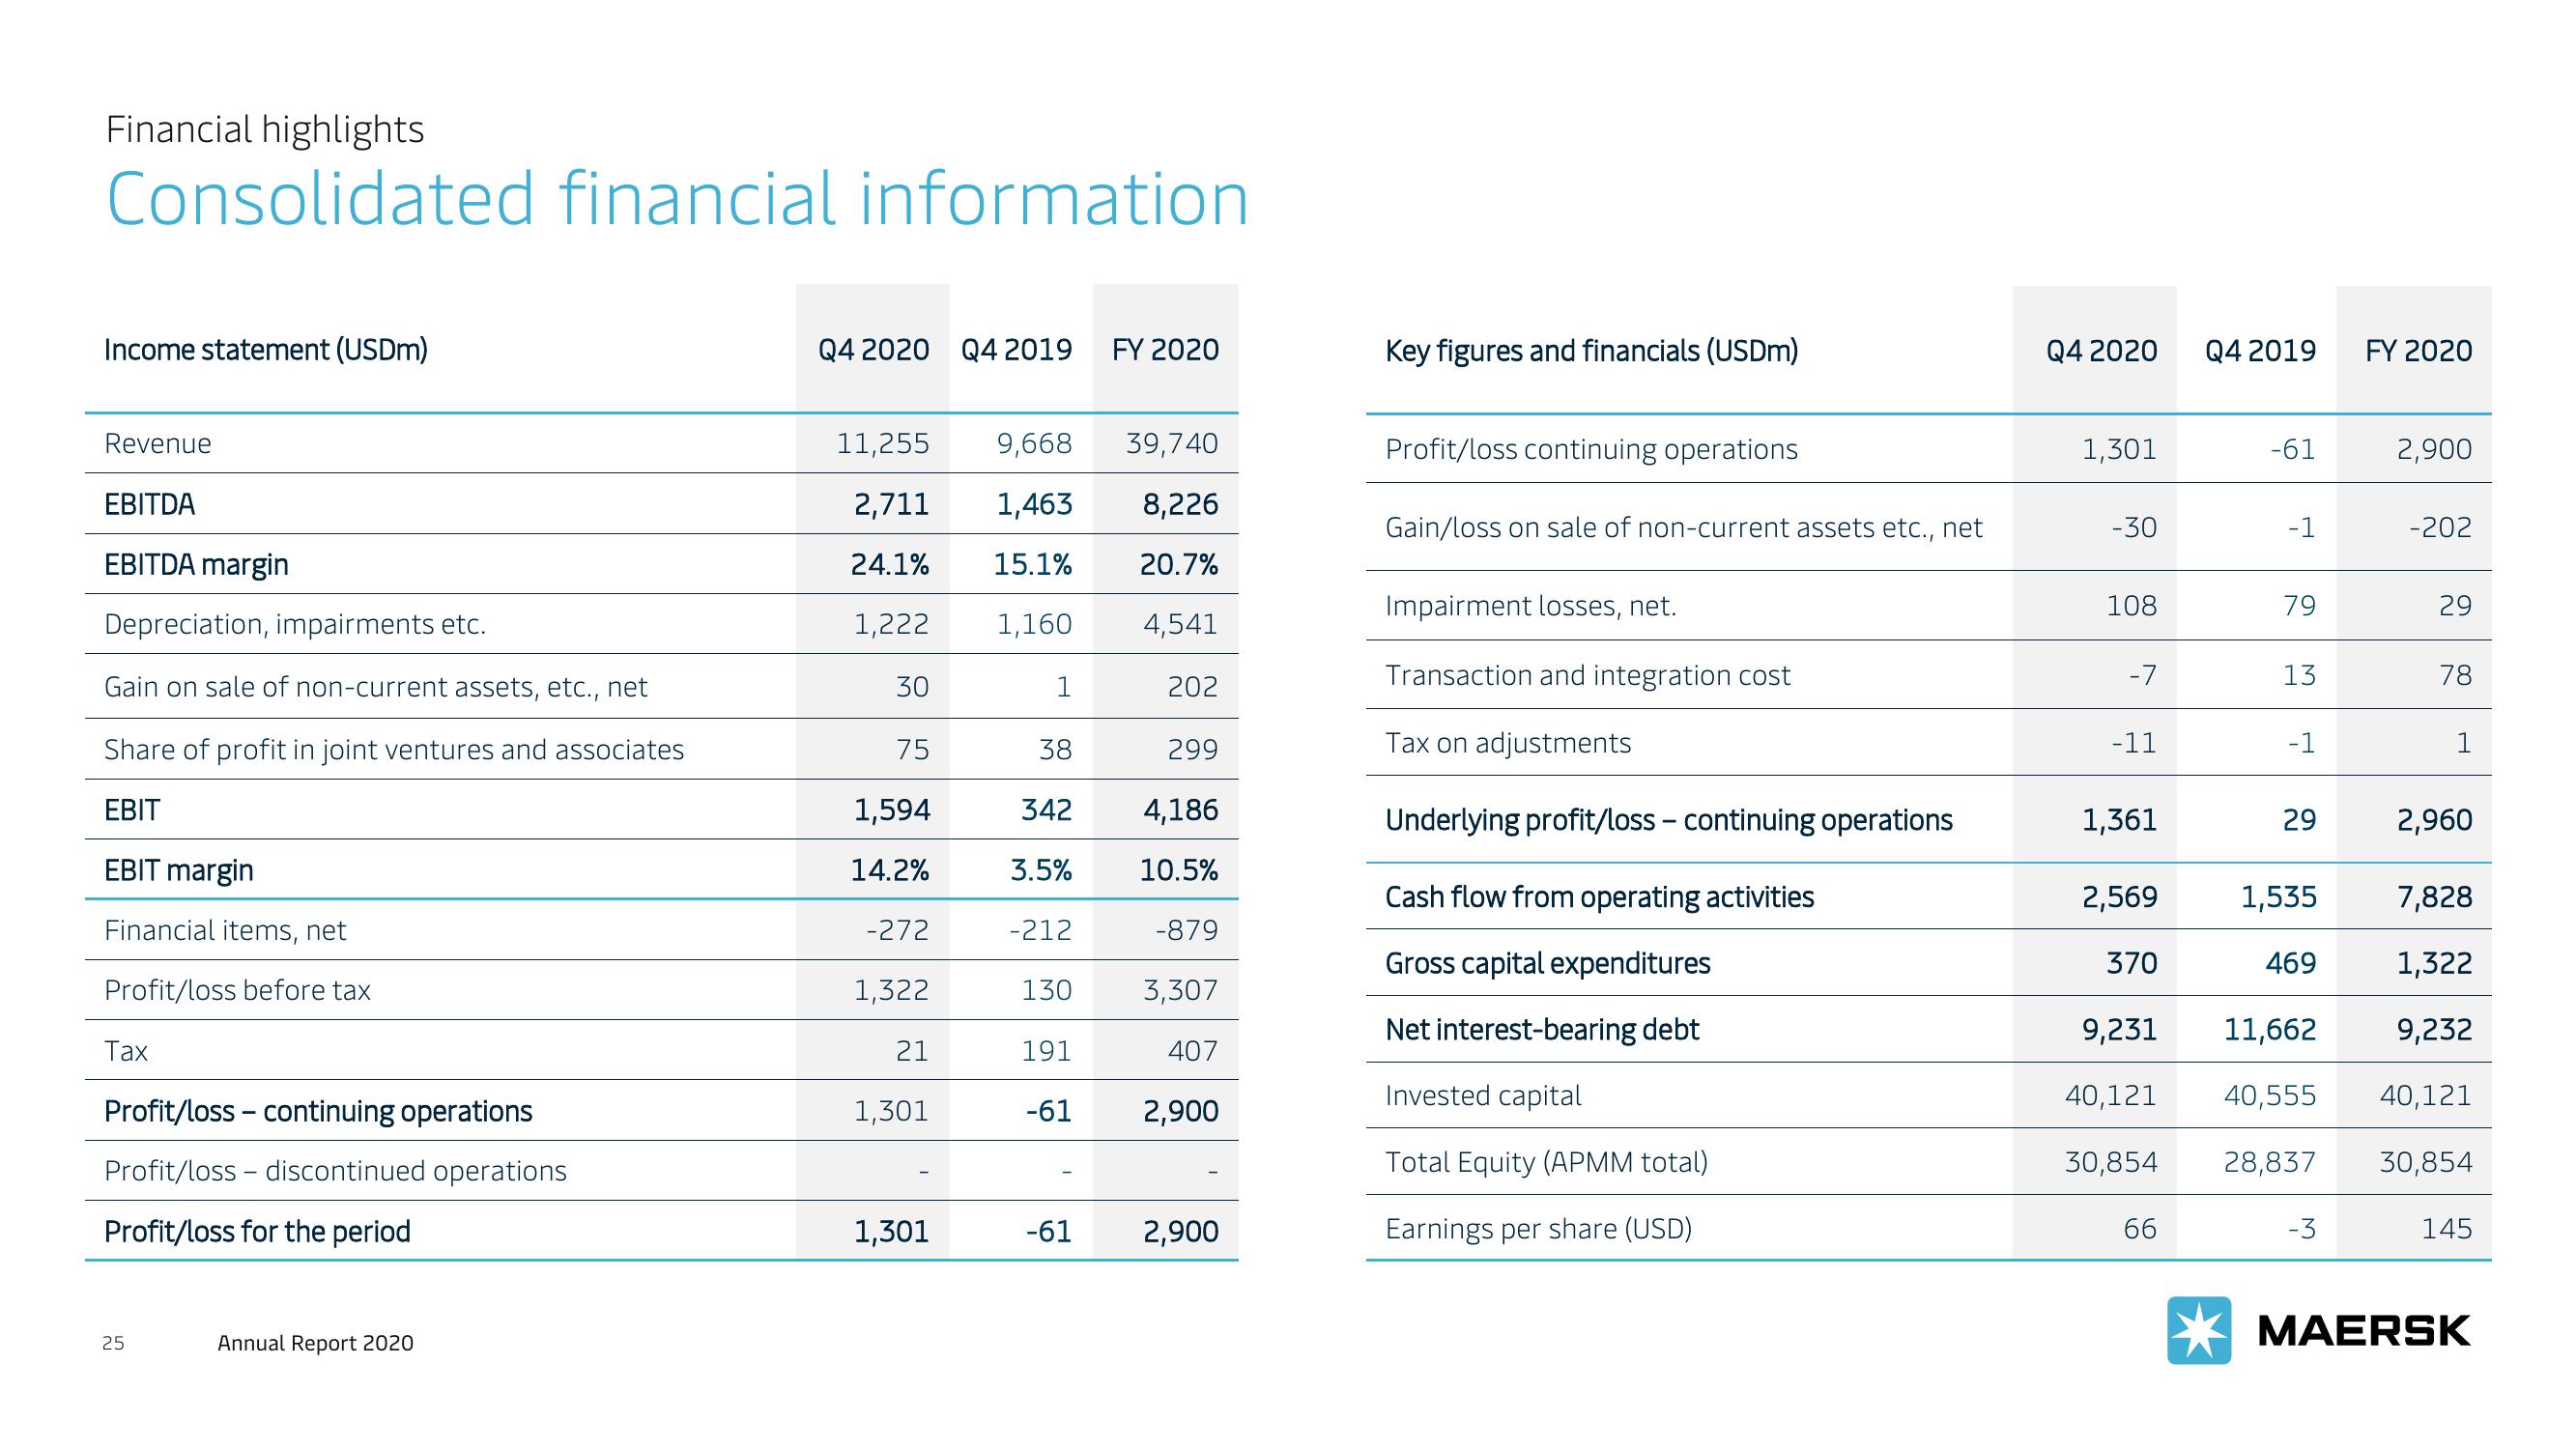
Income statement (USDm)
Revenue
EBITDA
EBITDA margin
Depreciation, impairments etc.
Gain on sale of non-current assets, etc., net
Share of profit in joint ventures and associates
EBIT
EBIT margin
Financial items, net
Profit/loss before tax
Tax
Profit/loss - continuing operations
Profit/loss discontinued operations
Profit/loss for the period
25
Annual Report 2020
Q4 2020 Q4 2019
11,255 9,668
2,711
1,463
24.1%
15.1%
1,222
1,160
30
75
1,594
14.2%
-272
1,322
21
1,301
1,301
1
38
342
3.5%
-212
130
FY 2020
299
4,186
10.5%
-879
3,307
191
407
-61 2,900
-61
39,740
8,226
20.7%
4,541
202
2,900
Key figures and financials (USDm)
Profit/loss continuing operations
Gain/loss on sale of non-current assets etc., net
Impairment losses, net.
Transaction and integration cost
Tax on adjustments
Underlying profit/loss - continuing operations
Cash flow from operating activities
Gross capital expenditures
Net interest-bearing debt
Invested capital
Total Equity (APMM total)
Earnings per share (USD)
Q4 2020
1,301
-30
108
-7
-11
1,361
2,569
370
9,231
40,121
30,854
66
Q4 2019
-61
-1
79
13
-1
29
1,535
469
11,662
40,555
28,837
-3
FY 2020
2,900
-202
29
78
1
2,960
7,828
1,322
9,232
40,121
30,854
145
MAERSKView entire presentation