Snap Inc Results Presentation Deck
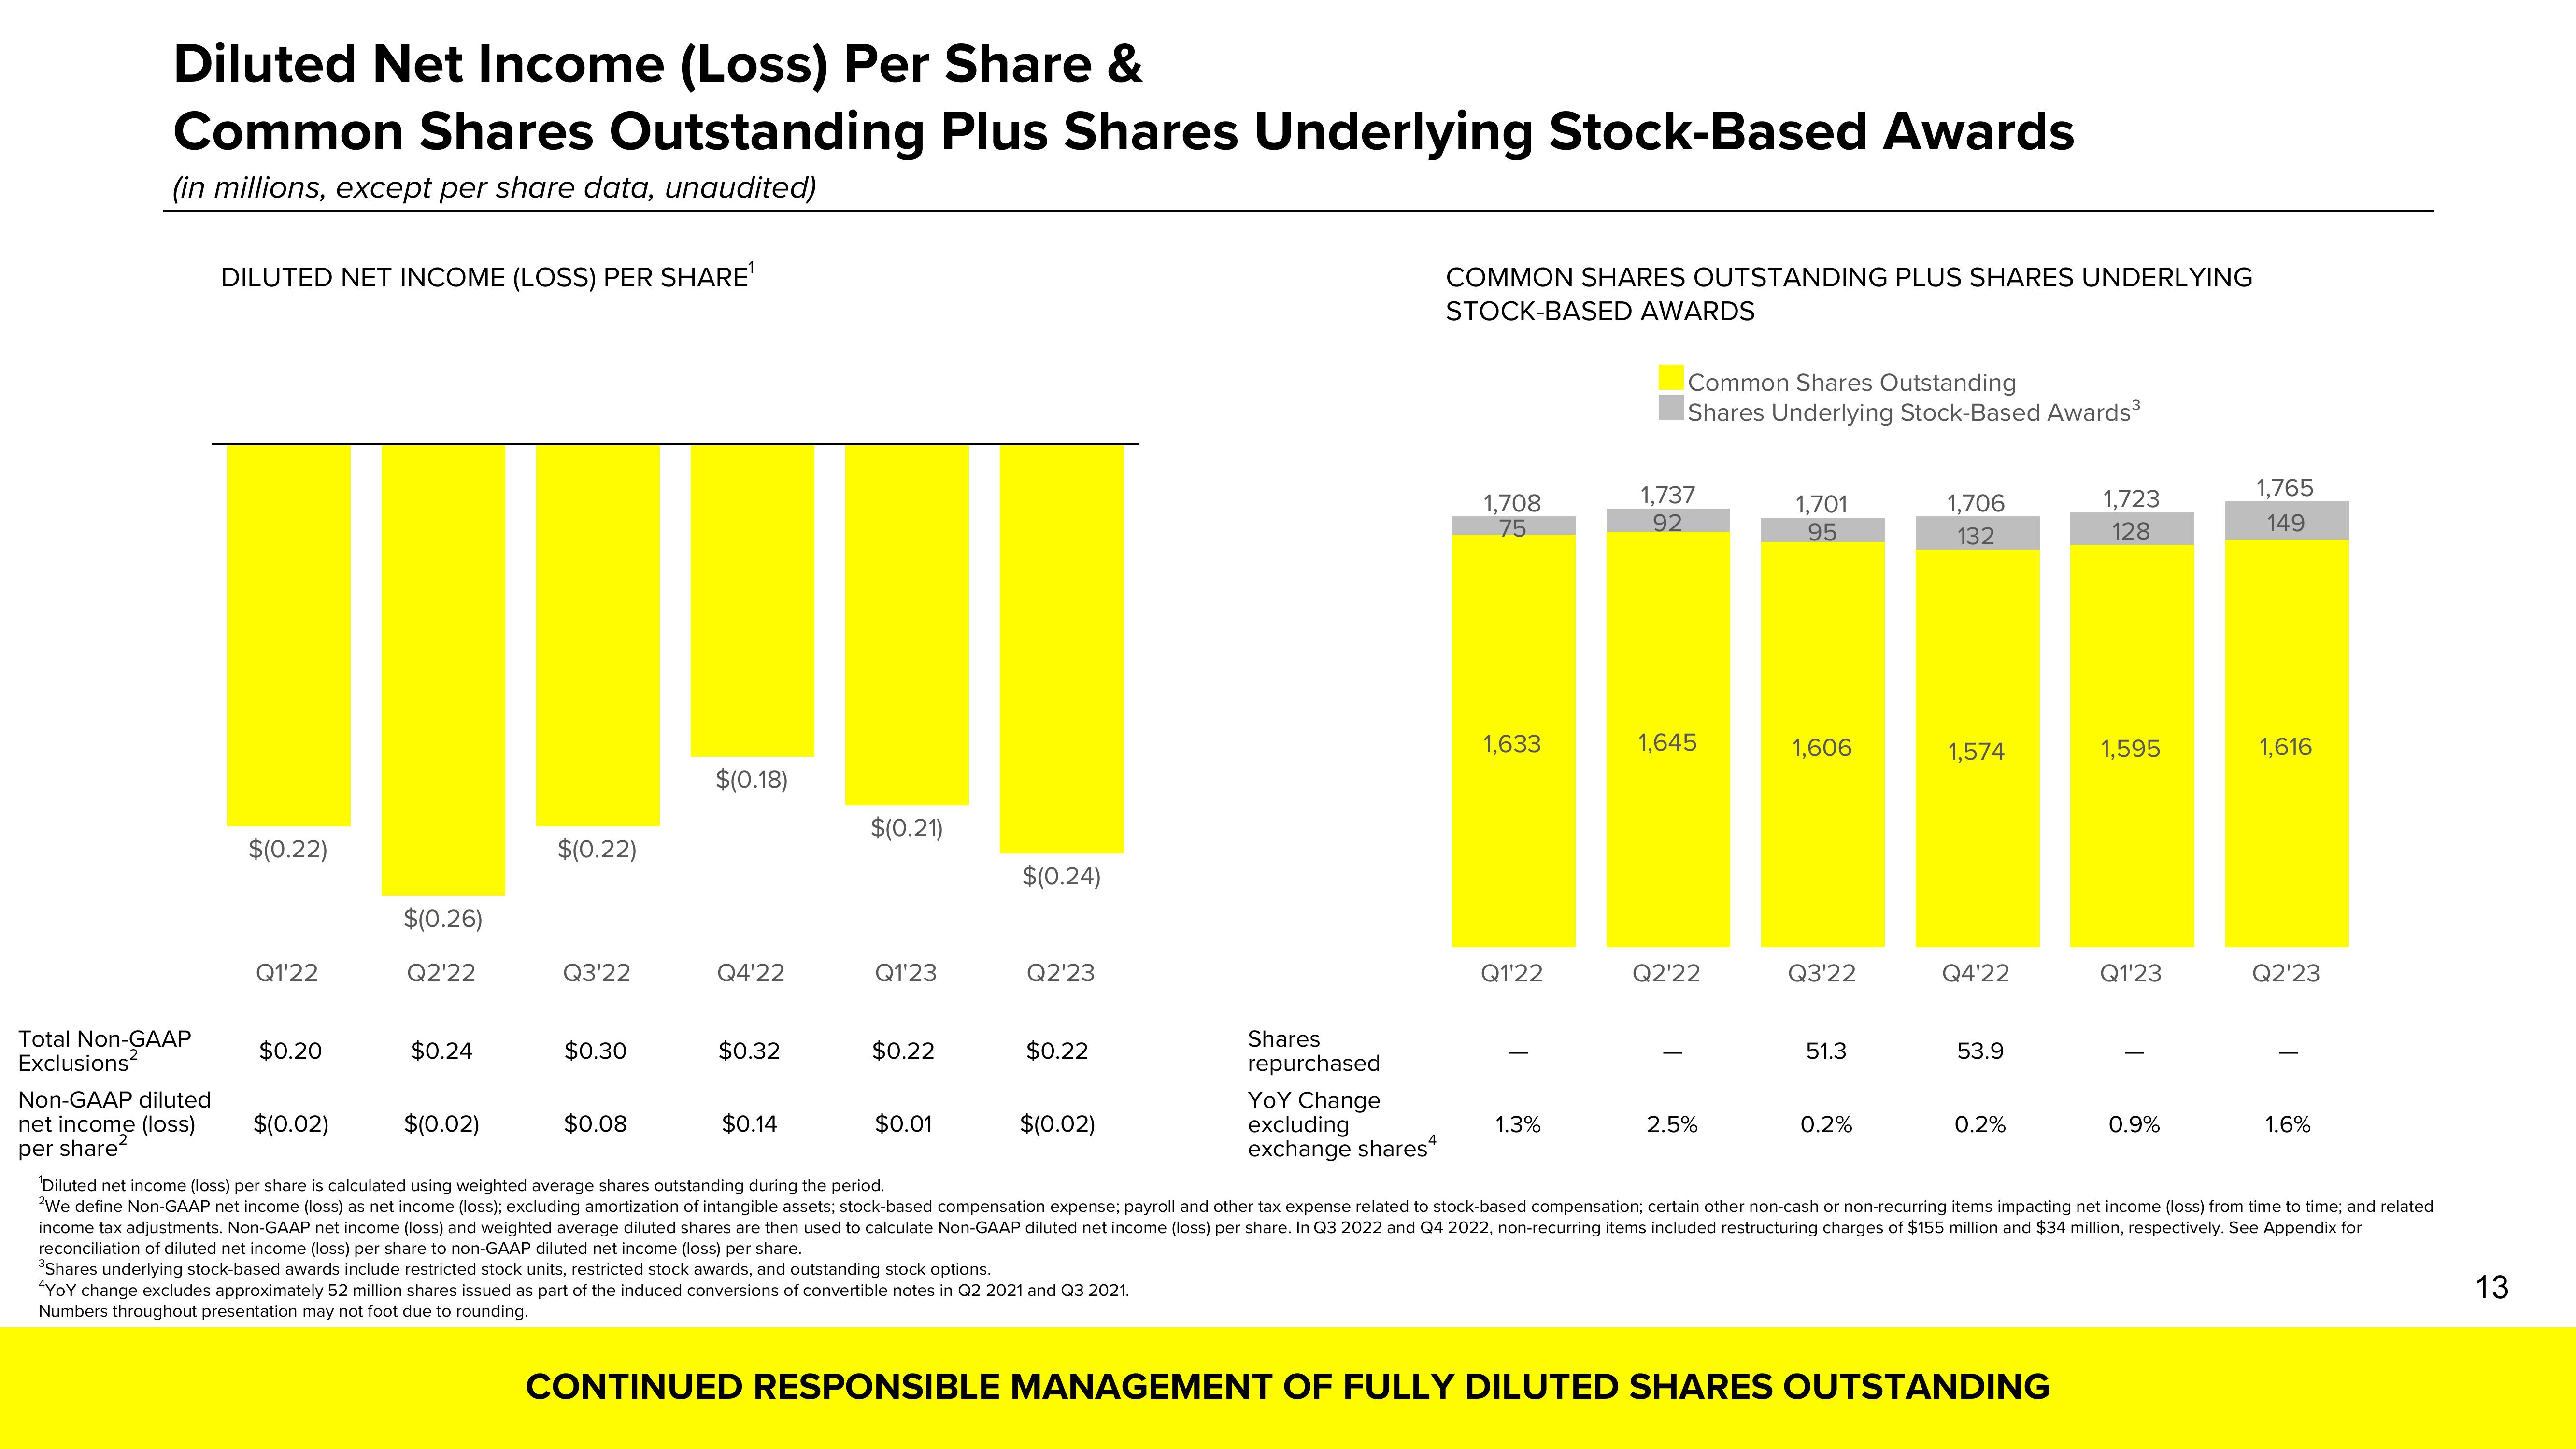
Diluted Net Income (Loss) Per Share &
Common Shares Outstanding Plus Shares Underlying Stock-Based Awards
(in millions, except per share data, unaudited)
DILUTED NET INCOME (LOSS) PER SHARE¹
$(0.22)
Q1'22
Total Non-GAAP
Exclusions
Non-GAAP diluted
net income (loss) $(0.02)
per share²
$0.20
$(0.26)
Q2'22
$0.24
$(0.22)
Q3'22
$0.30
$0.08
$(0.18)
Q4'22
$0.32
$0.14
$(0.21)
Q1'23
$0.22
$0.01
$(0.24)
Q2'23
$0.22
$(0.02)
Shares
repurchased
YOY Change
excluding
exchange shares
COMMON SHARES OUTSTANDING PLUS SHARES UNDERLYING
STOCK-BASED AWARDS
1,708
75
1,633
Q1'22
1.3%
Common Shares Outstanding
Shares Underlying Stock-Based Awards³
1,737
92
1,645
Q2'22
1,701
95
2.5%
1,606
Q3'22
51.3
1,706
132
0.2%
1,574
Q4'22
53.9
$(0.02)
'Diluted net income (loss) per share is calculated using weighted average shares outstanding during the period.
2We define Non-GAAP net income (loss) as net income (loss); excluding amortization of intangible assets; stock-based compensation expense; payroll and other tax expense related to stock-based compensation; certain other non-cash or non-recurring items impacting net income (loss) from time to time; and related
income tax adjustments. Non-GAAP net income (loss) and weighted average diluted shares are then used to calculate Non-GAAP diluted net income (loss) per share. In Q3 2022 and Q4 2022, non-recurring items included restructuring charges of $155 million and $34 million, respectively. See Appendix for
reconciliation of diluted net income (loss) per share to non-GAAP diluted net income (loss) per share.
³Shares underlying stock-based awards include restricted stock units, restricted stock awards, and outstanding stock options.
¹YOY change excludes approximately 52 million shares issued as part of the induced conversions of convertible notes in Q2 2021 and Q3 2021.
Numbers throughout presentation may not foot due to rounding.
0.2%
1,723
128
CONTINUED RESPONSIBLE MANAGEMENT OF FULLY DILUTED SHARES OUTSTANDING
1,595
Q1'23
1,765
149
0.9%
1,616
Q2'23
1.6%
13View entire presentation