Grove Investor Presentation Deck slide image

Grove Investor Presentation Deck

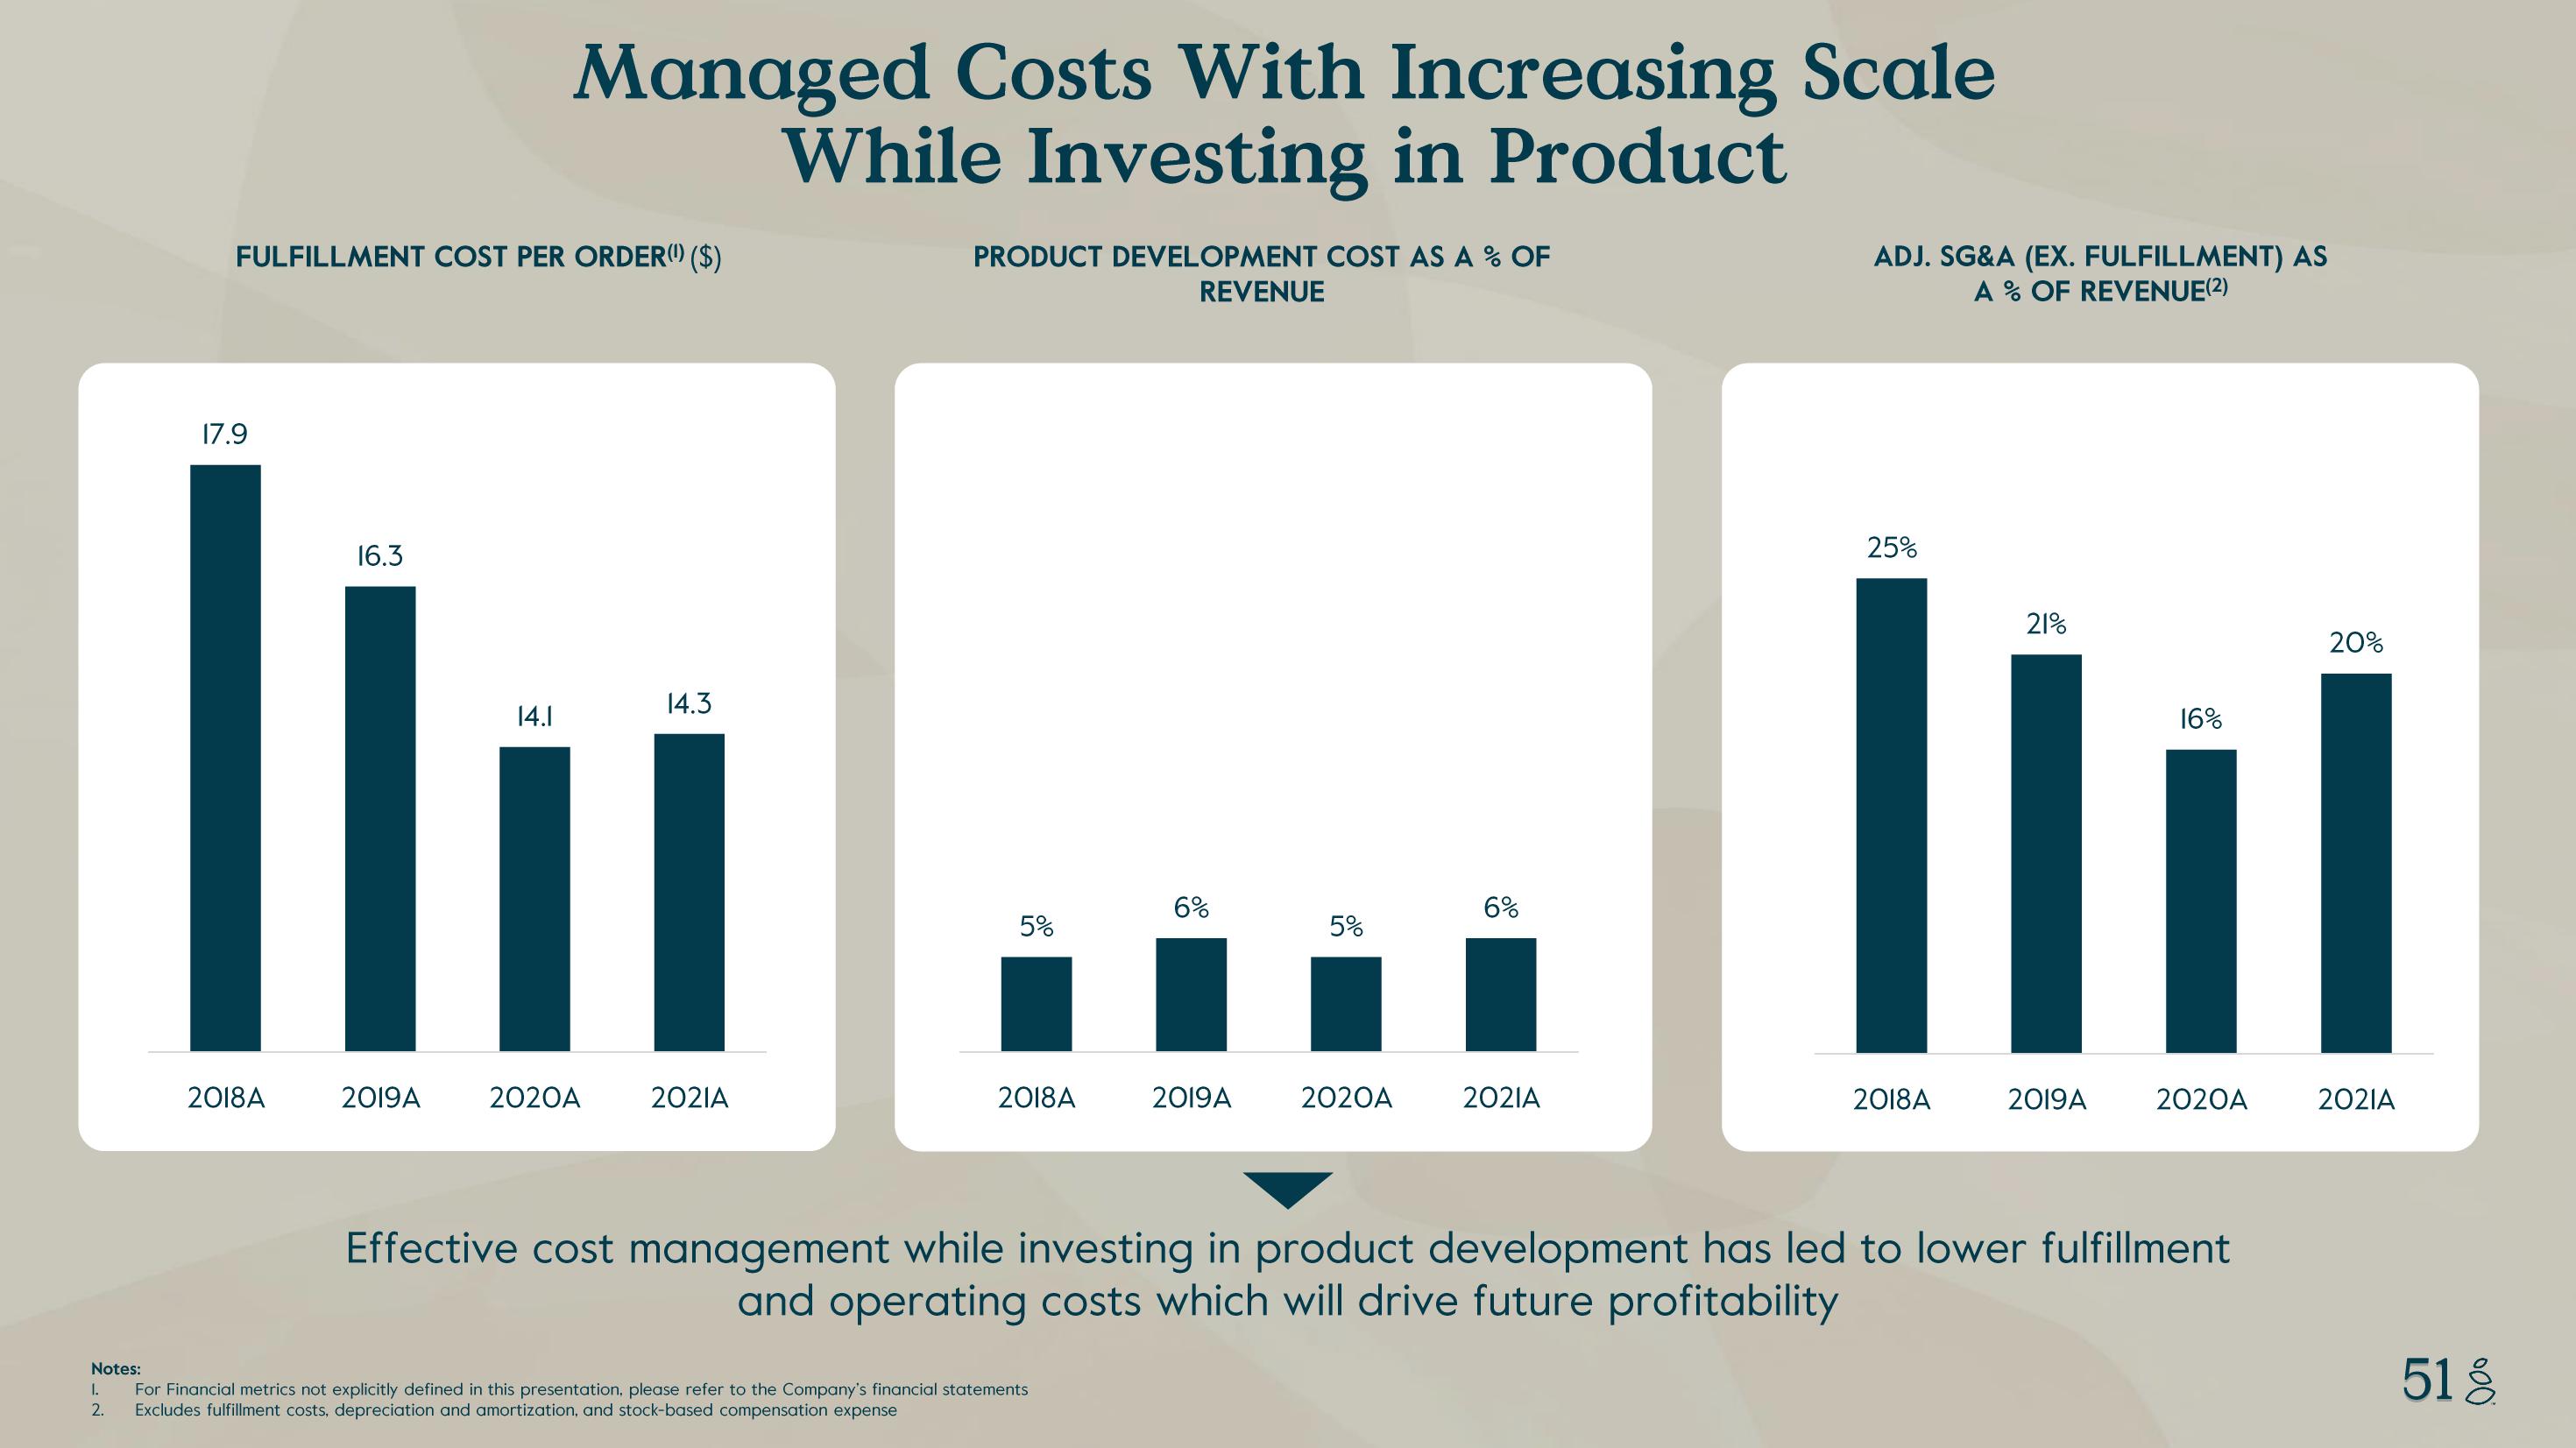
FULFILLMENT COST PER ORDER() ($) 17.9 Managed Costs With Increasing Scale While Investing in Product 16.3 14.3 14.1 lu 2018A 2019A 2020A 2021A PRODUCT DEVELOPMENT COST AS A % OF REVENUE 5% 2018A 6% Notes: I. For Financial metrics not explicitly defined in this presentation, please refer to the Company's financial statements 2. Excludes fulfillment costs, depreciation and amortization, and stock-based compensation expense 2019A 5% 2020A 6% 2021A ADJ. SG&A (EX. FULFILLMENT) AS A % OF REVENUE(2) 25% 21% 16% lii 2018A 2019A 2020A Effective cost management while investing in product development has led to lower fulfillment and operating costs which will drive future profitability 20% 2021A 51 %
View entire presentation