Axos Financial, Inc. Fixed Income Investor Presentation
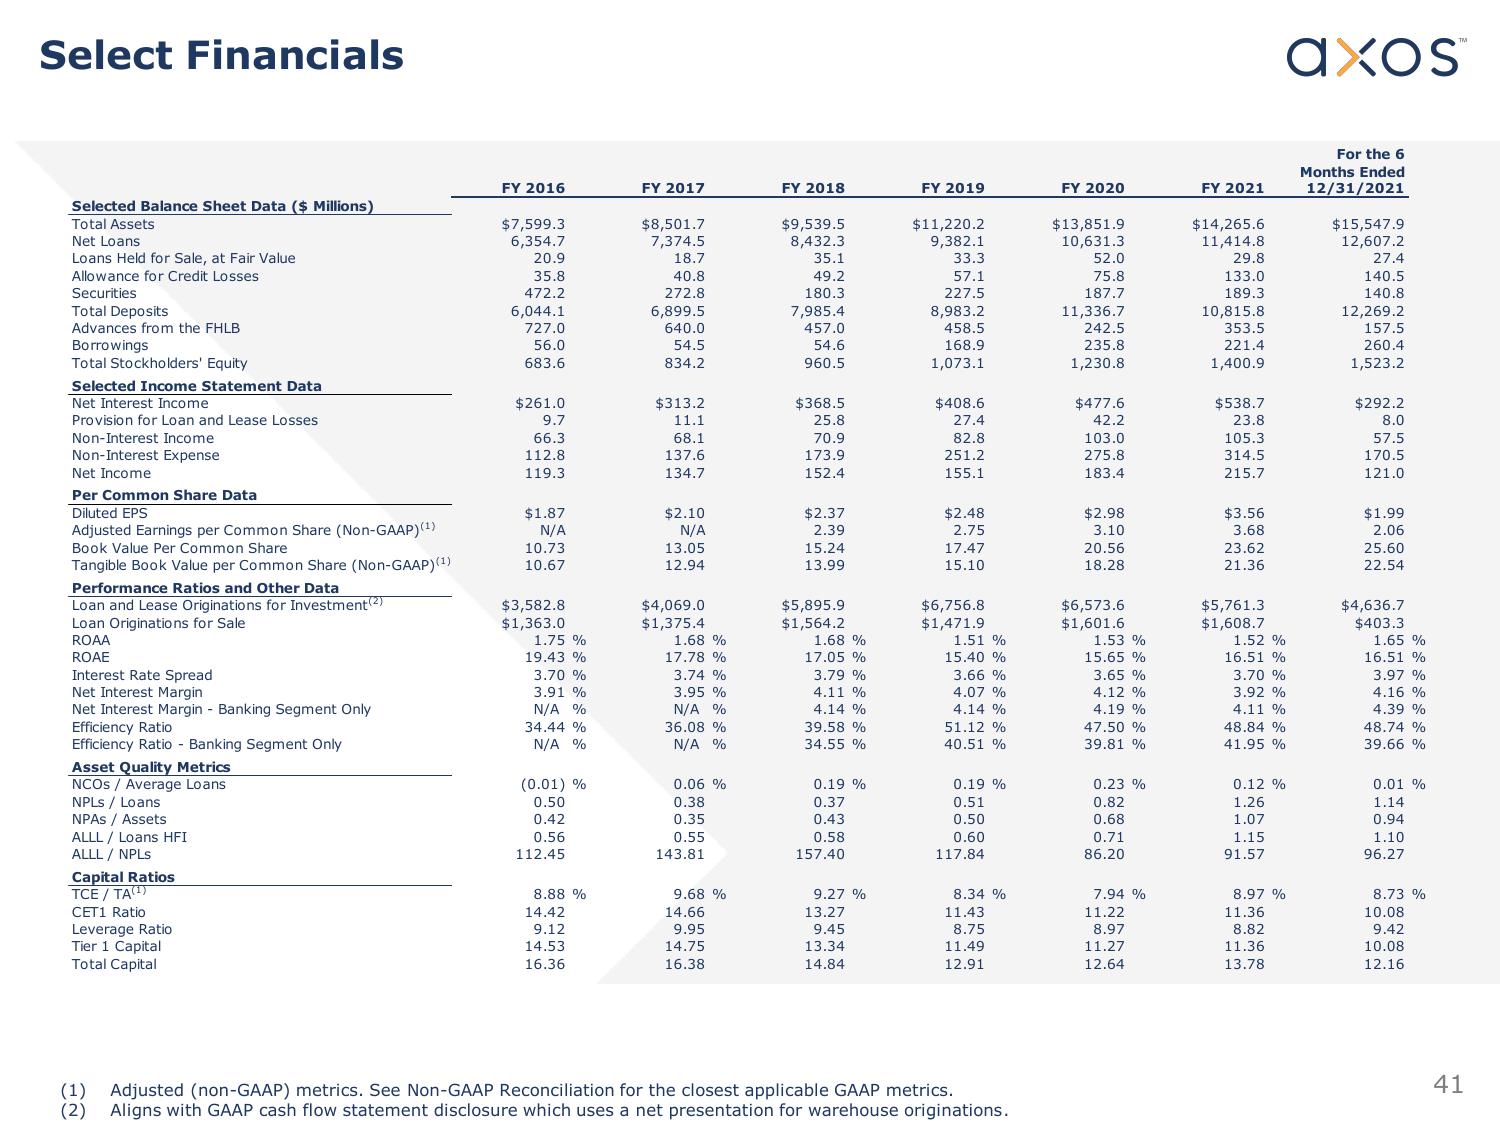
Select Financials
Selected Balance Sheet Data ($ Millions)
Total Assets
Net Loans
Loans Held for Sale, at Fair Value
Allowance for Credit Losses
Securities
Total Deposits
Advances from the FHLB
Borrowings
Total Stockholders' Equity
Selected Income Statement Data
Net Interest Income
Provision for Loan and Lease Losses
Non-Interest Income
Non-Interest Expense
Net Income
Per Common Share Data
Diluted EPS
Adjusted Earnings per Common Share (Non-GAAP)(¹)
Book Value Per Common Share
Tangible Book Value per Common Share (Non-GAAP)(¹)
Performance Ratios and Other Data
Loan and Lease Originations for Investment (2)
Loan Originations for Sale
ROAA
ROAE
Interest Rate Spread
Net Interest Margin
Net Interest Margin - Banking Segment Only
Efficiency Ratio
Efficiency Ratio - Banking Segment Only
Asset Quality Metrics
NCOS / Average Loans
NPLS / Loans
NPAS / Assets
ALLL / Loans HFI
ALLL / NPLs
Capital Ratios
TCE / TA(¹)
CET1 Ratio
Leverage Ratio
Tier 1 Capital
Total Capital
FY 2016
$7,599.3
6,354.7
20.9
35.8
472.2
6,044.1
727.0
56.0
683.6
$261.0
9.7
66.3
112.8
119.3
$1.87
N/A
10.73
10.67
$3,582.8
$1,363.0
1.75 %
19.43 %
3.70 %
3.91 %
N/A %
34.44 %
N/A %
(0.01) %
0.50
0.42
0.56
112.45
8.88 %
14.42
9.12
14.53
16.36
FY 2017
$8,501.7
7,374.5
18.7
40.8
272.8
6,899.5
640.0
54.5
834.2
$313.2
11.1
68.1
137.6
134.7
$2.10
N/A
13.05
12.94
$4,069.0
$1,375.4
1.68 %
17.78 %
3.74 %
3.95 %
N/A %
36.08 %
N/A %
0.06 %
0.38
0.35
0.55
143.81
9.68 %
14.66
9.95
14.75
16.38
FY 2018
$9,539.5
8,432.3
35.1
49.2
180.3
7,985.4
457.0
54.6
960.5
$368.5
25.8
70.9
173.9
152.4
$2.37
2.39
15.24
13.99
$5,895.9
$1,564.2
1.68 %
17.05 %
3.79 %
4.11 %
4.14 %
39.58 %
34.55 %
0.19 %
0.37
0.43
0.58
157.40
9.27 %
13.27
9.45
13.34
14.84
FY 2019
$11,220.2
9,382.1
33.3
57.1
227.5
8,983.2
458.5
168.9
1,073.1
$408.6
27.4
82.8
251.2
155.1
$2.48
2.75
17.47
15.10
$6,756.8
$1,471.9
1.51 %
15.40 %
3.66 %
4.07 %
4.14 %
51.12 %
40.51 %
0.19 %
0.51
0.50
0.60
117.84
8.34 %
11.43
8.75
11.49
12.91
(1)
Adjusted (non-GAAP) metrics. See Non-GAAP Reconciliation for the closest applicable GAAP metrics.
(2) Aligns with GAAP cash flow statement disclosure which uses a net presentation for warehouse originations.
FY 2020
$13,851.9
10,631.3
52.0
75.8
187.7
11,336.7
242.5
235.8
1,230.8
$477.6
42.2
103.0
275.8
183.4
$2.98
3.10
20.56
18.28
$6,573.6
$1,601.6
1.53 %
15.65 %
3.65 %
4.12 %
4.19 %
47.50 %
39.81 %
0.23%
0.82
0.68
0.71
86.20
7.94 %
11.22
8.97
11.27
12.64
FY 2021
$14,265.6
11,414.8
29.8
133.0
189.3
10,815.8
353.5
221.4
1,400.9
$538.7
23.8
105.3
314.5
215.7
$3.56
3.68
23.62
21.36
$5,761.3
$1,608.7
1.52 %
16.51 %
3.70 %
3.92 %
4.11 %
48.84 %
41.95 %
0.12 %
1.26
1.07
1.15
91.57
8.97 %
11.36
8.82
11.36
13.78
axos
For the 6
Months Ended
12/31/2021
$15,547.9
12,607.2
27.4
140.5
140.8
12,269.2
157.5
260.4
1,523.2
$292.2
8.0
57.5
170.5
121.0
$1.99
2.06
25.60
22.54
$4,636.7
$403.3
1.65 %
16.51 %
3.97 %
4.16 %
4.39 %
48.74 %
39.66 %
0.01 %
1.14
0.94
1.10
96.27
8.73 %
10.08
9.42
10.08
12.16
41View entire presentation