Proterra SPAC Presentation Deck
PROTERRA FINANCIALS
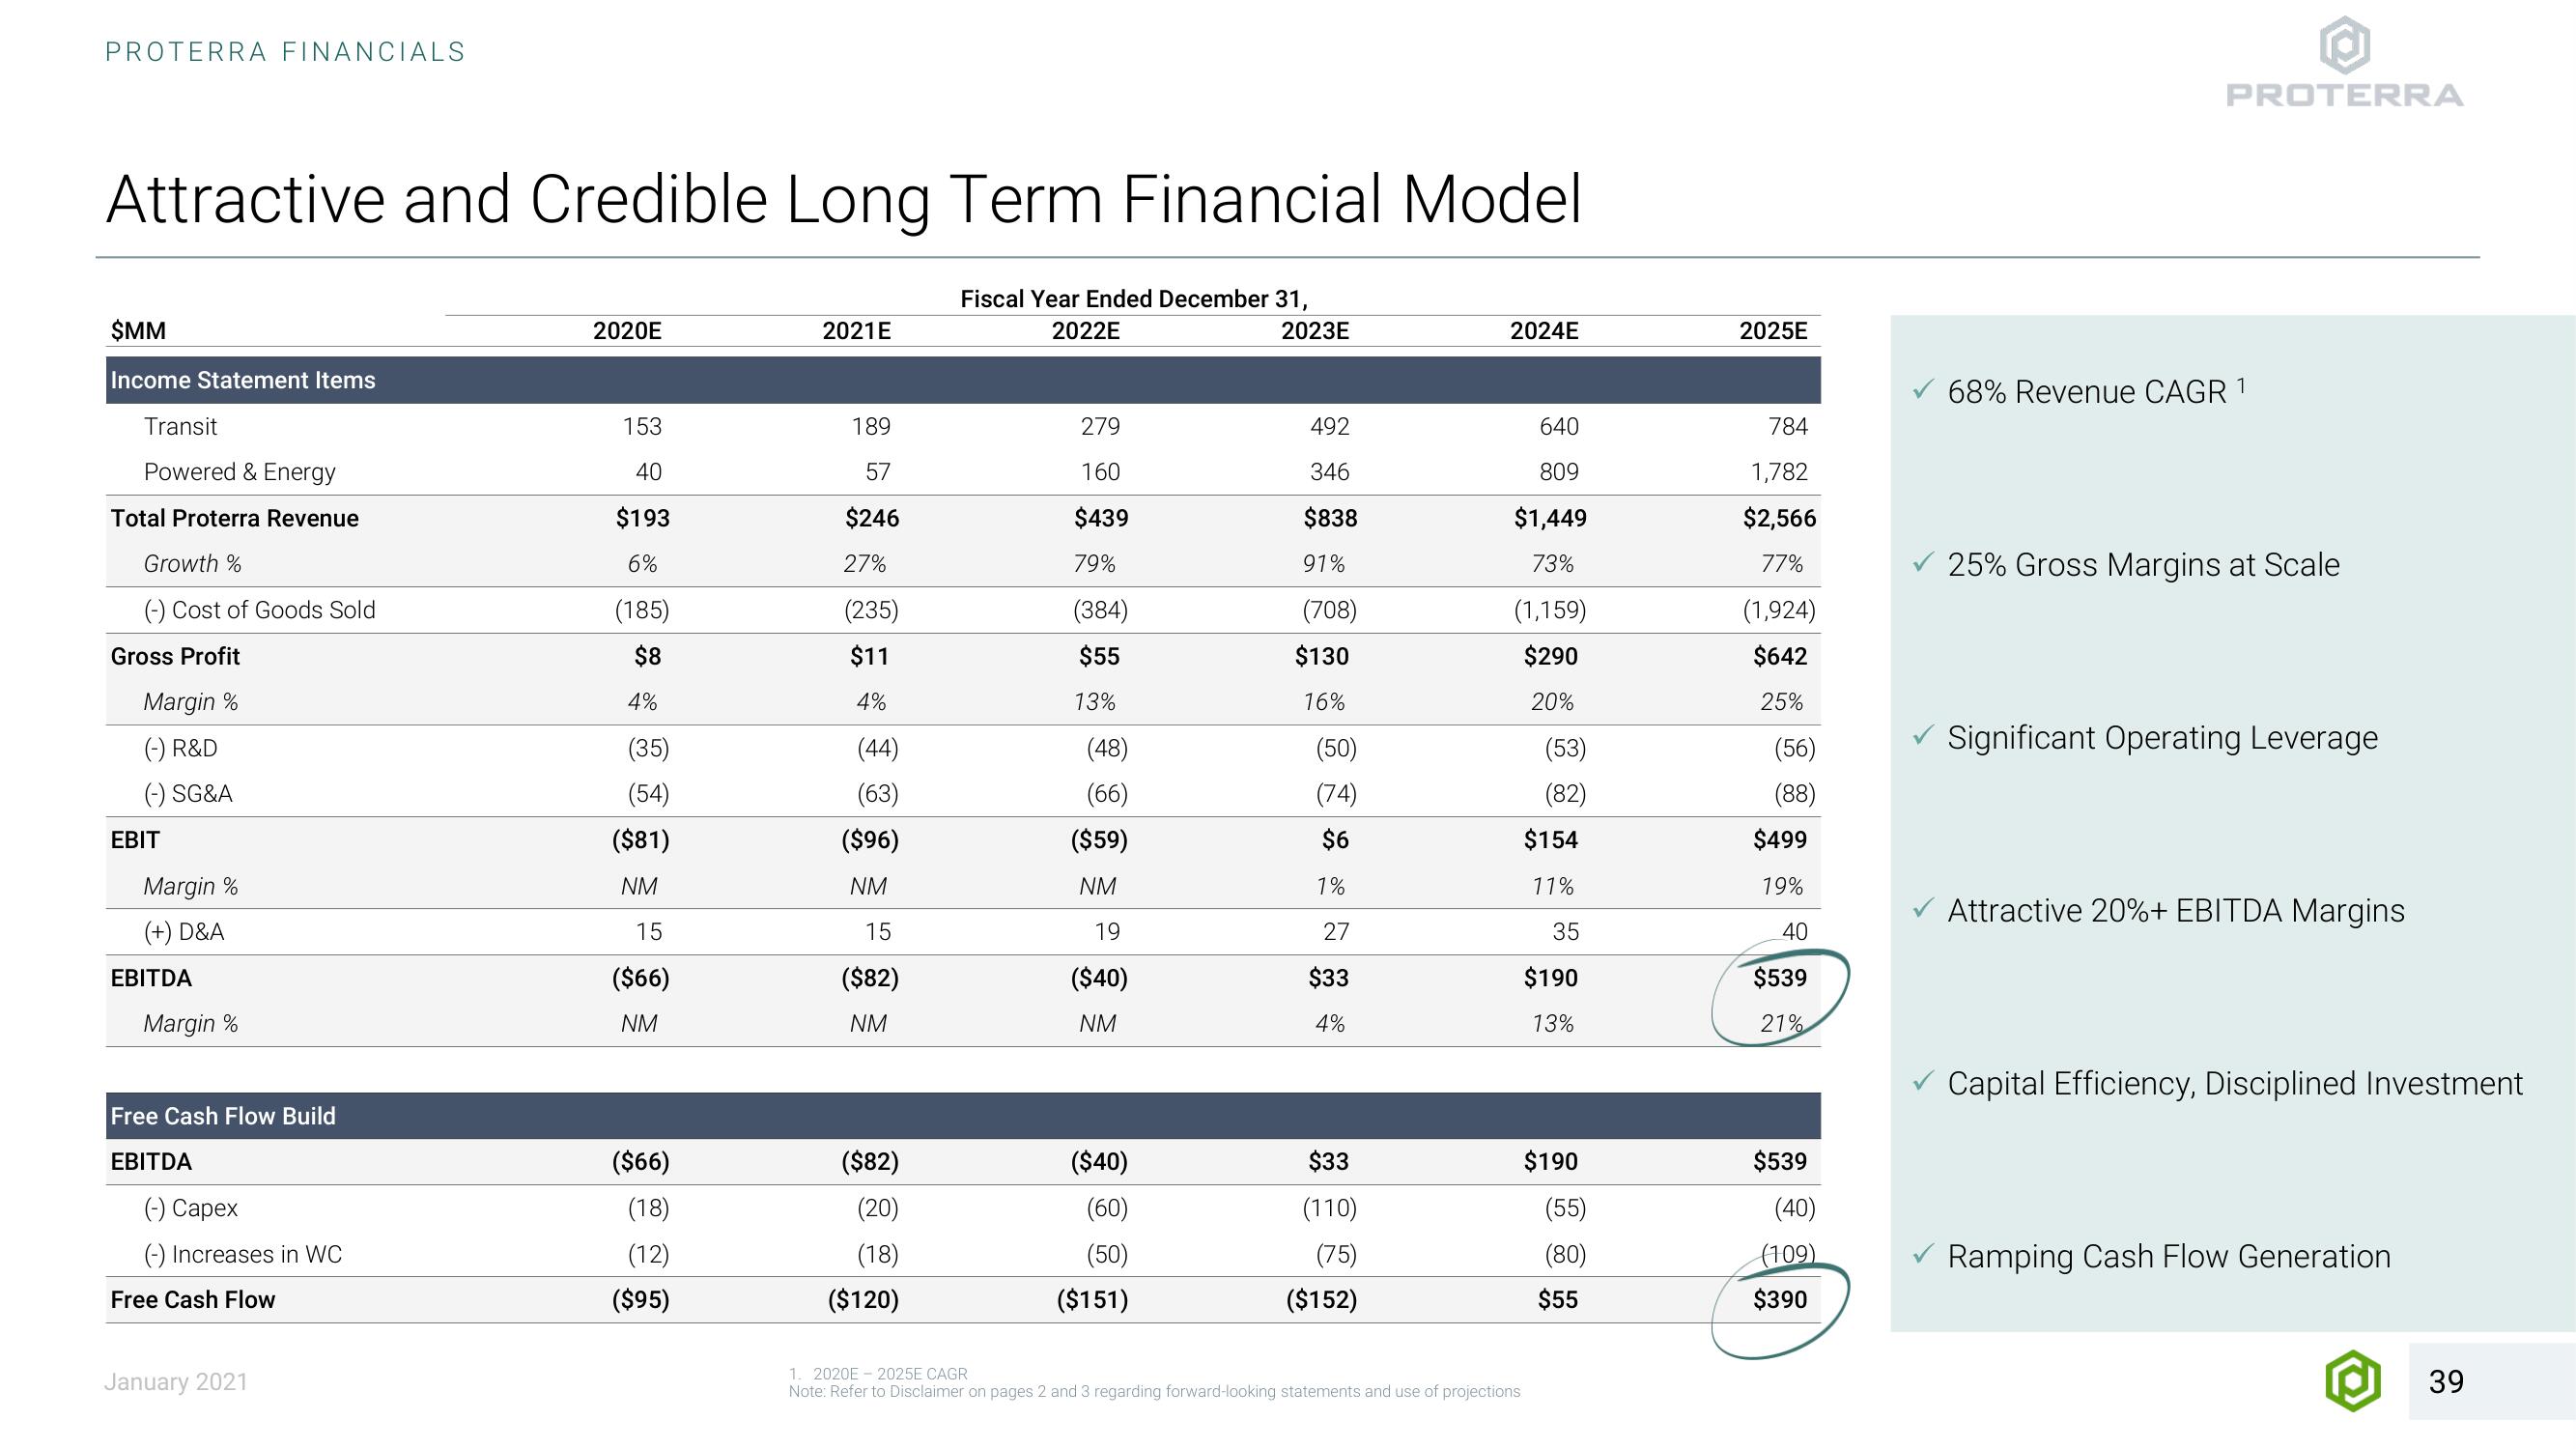
Attractive and Credible Long Term Financial Model
Fiscal Year Ended December 31,
2022E
SMM
Income Statement Items
Transit
Powered & Energy
Total Proterra Revenue
Growth %
(-) Cost of Goods Sold
Gross Profit
Margin %
(-) R&D
(-) SG&A
EBIT
Margin %
(+) D&A
EBITDA
Margin %
Free Cash Flow Build
EBITDA
(-) Capex
(-) Increases in WC
Free Cash Flow
January 2021
2020E
153
40
$193
6%
(185)
$8
4%
(35)
(54)
($81)
NM
15
($66)
NM
($66)
(18)
(12)
($95)
2021E
189
57
$246
27%
(235)
$11
4%
(44)
(63)
($96)
NM
15
($82)
NM
($82)
(20)
(18)
($120)
279
160
$439
79%
(384)
$55
13%
(48)
(66)
($59)
NM
19
($40)
NM
($40)
(60)
(50)
($151)
2023E
492
346
$838
91%
(708)
$130
16%
(50)
(74)
$6
1%
27
$33
4%
$33
(110)
(75)
($152)
2024E
640
809
$1,449
73%
(1,159)
$290
20%
1. 2020E-2025E CAGR
Note: Refer to Disclaimer on pages 2 and 3 regarding forward-looking statements and use of projections
(53)
(82)
$154
11%
35
$190
13%
$190
(55)
(80)
$55
2025E
784
1,782
$2,566
77%
(1,924)
$642
25%
(56)
(88)
$499
19%
40
$539
21%
$539
(40)
(109)
$390
PROTERRA
68% Revenue CAGR 1
25% Gross Margins at Scale
✓Significant Operating Leverage
Attractive 20%+ EBITDA Margins
Capital Efficiency, Disciplined Investment
Ramping Cash Flow Generation
39View entire presentation