HBT Financial Results Presentation Deck
1... drives long-term tangible book value growth
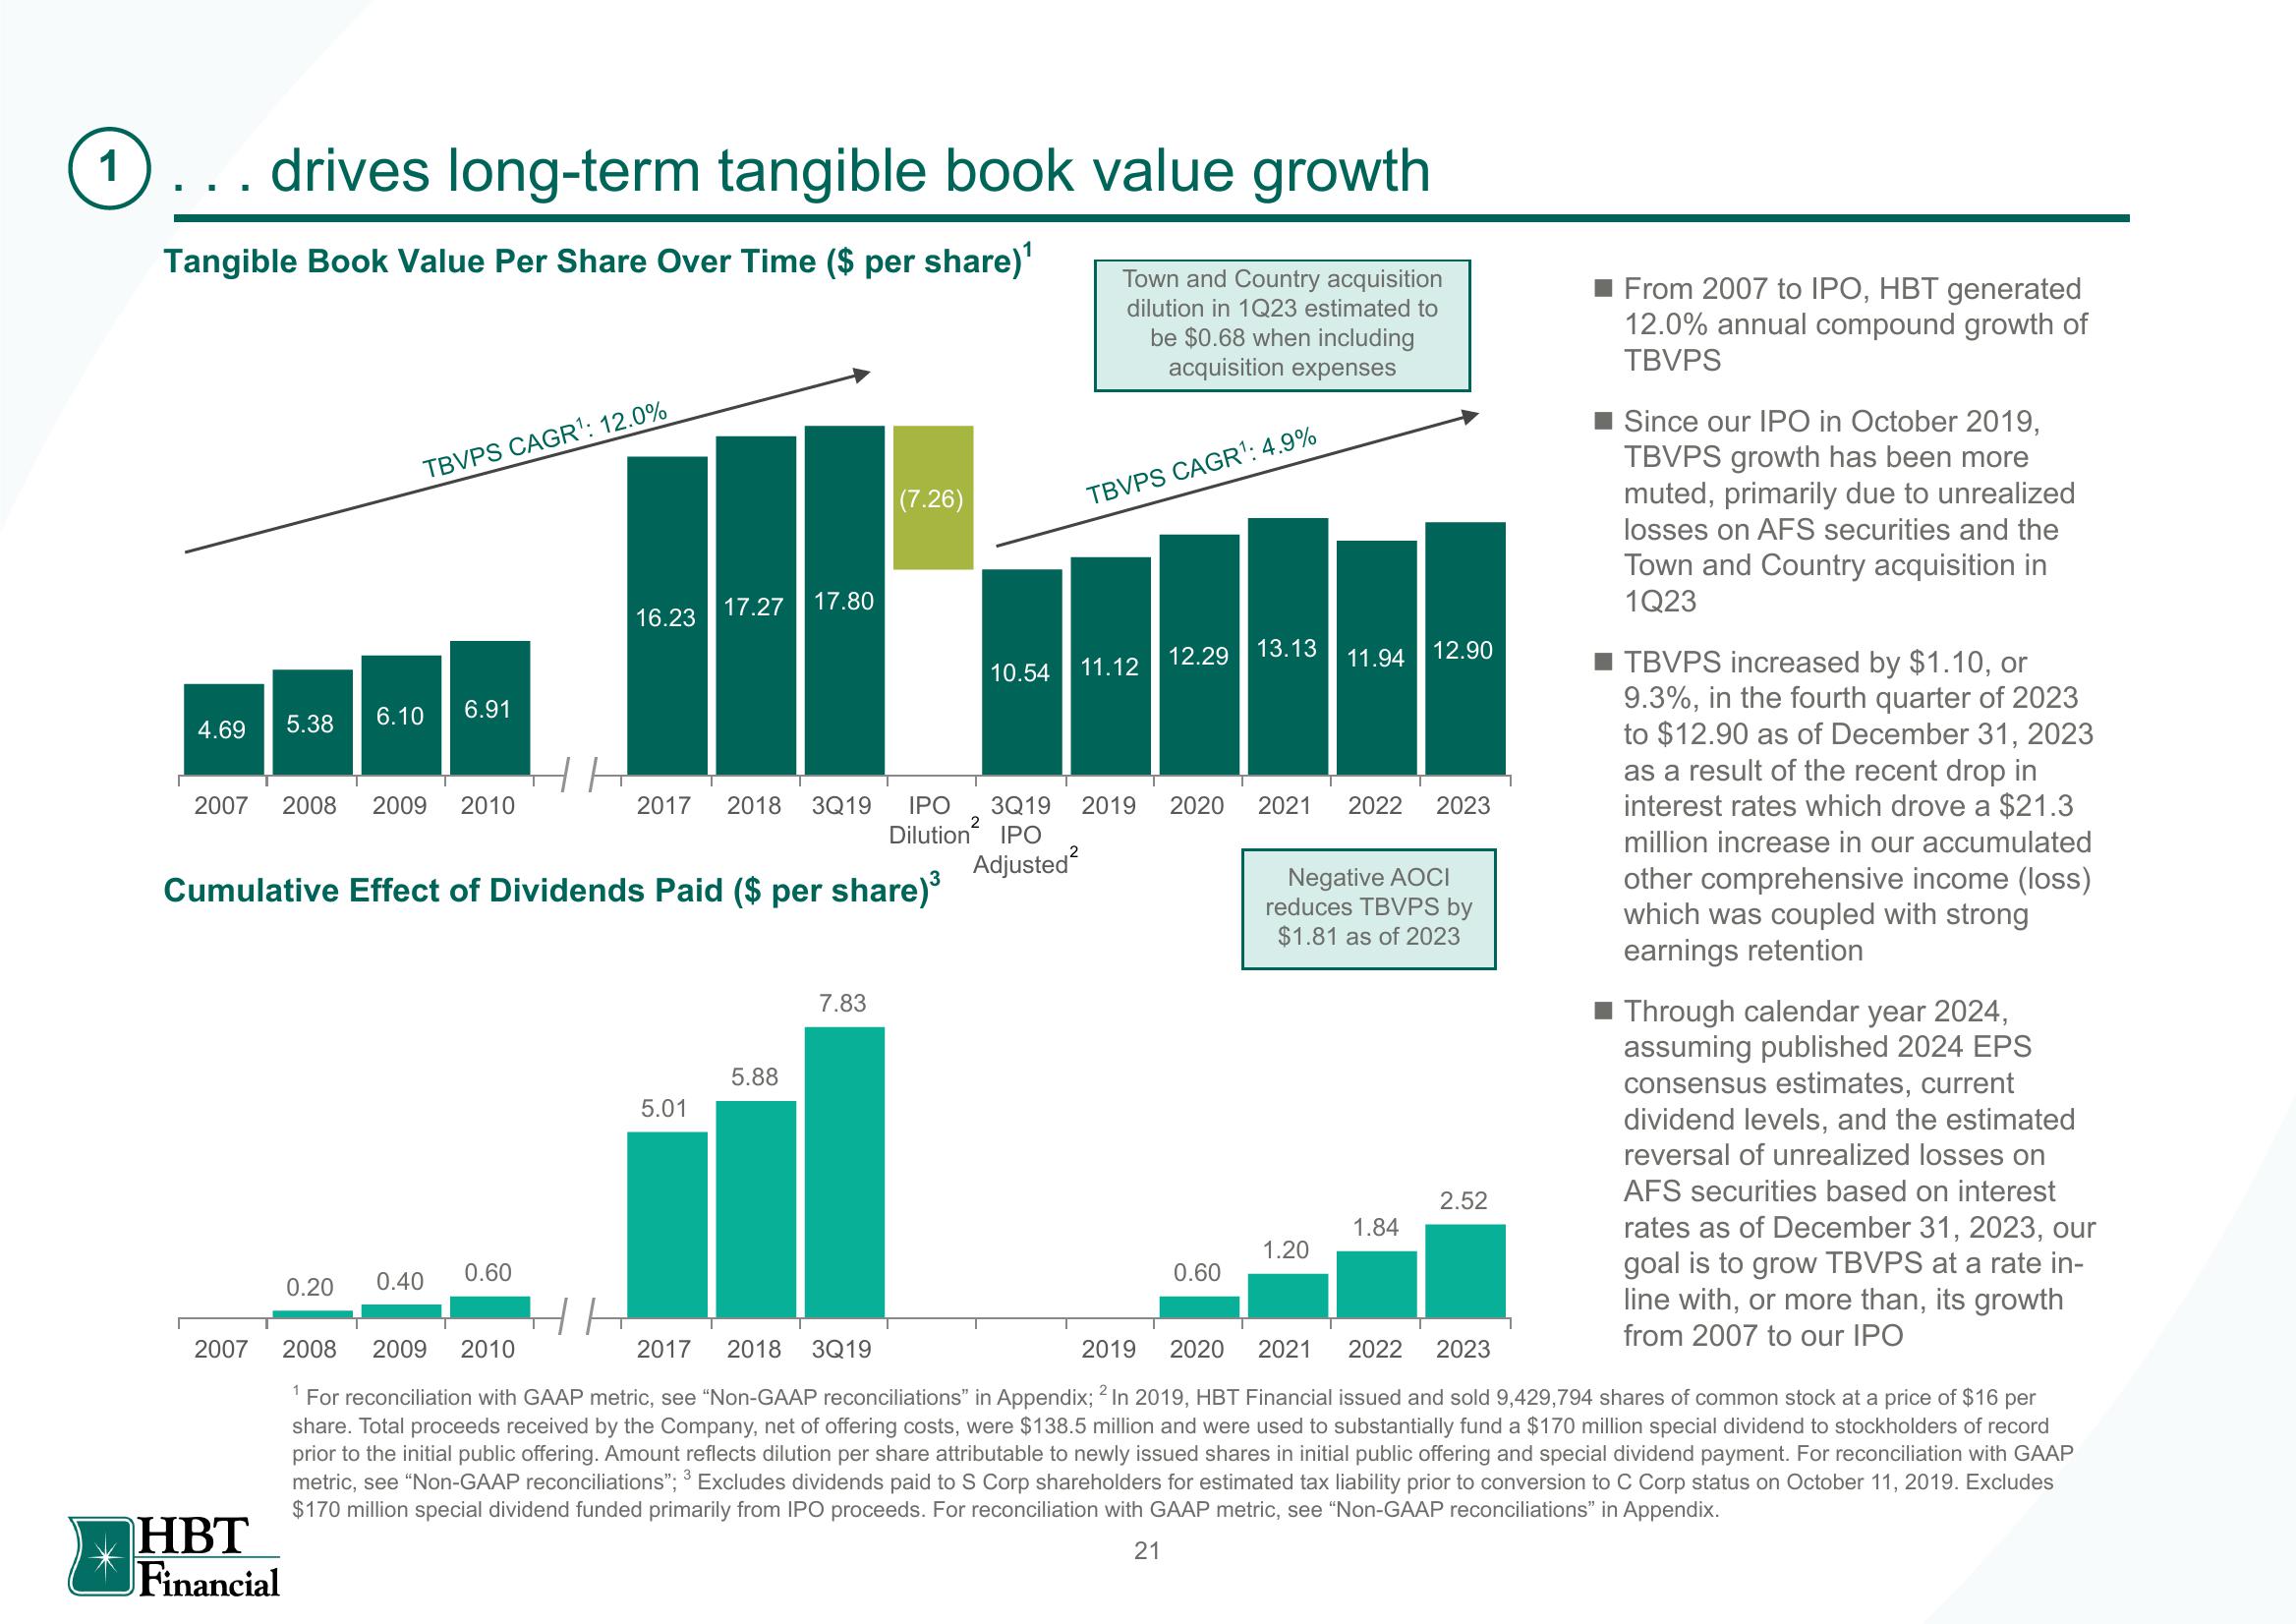
Tangible Book Value Per Share Over Time ($ per share)¹
4.69 5.38
TBVPS CAGR¹: 12.0%
2007 2008 2009 2010
2007
6.10 6.91
HBT
Financial
0.20 0.40
16.23
Cumulative Effect of Dividends Paid ($ per share)³
0.60
17.27 17.80
5.01
(7.26)
5.88
7.83
10.54
Town and Country acquisition
dilution in 1Q23 estimated to
be $0.68 when including
acquisition expenses
TBVPS CAGR¹: 4.9%
11.12
2017 2018 3Q19 IPO 3Q19 2019 2020 2021 2022 2023
Dilution IPO
Adjusted²
12.29
13.13
0.60
11.94 12.90
Negative AOCI
reduces TBVPS by
$1.81 as of 2023
1.20
1.84
2.52
■ From 2007 to IPO, HBT generated
12.0% annual compound growth of
TBVPS
Since our IPO in October 2019,
TBVPS growth has been more
muted, primarily due to unrealized
losses on AFS securities and the
Town and Country acquisition in
1Q23
■ TBVPS increased by $1.10, or
9.3%, in the fourth quarter of 2023
to $12.90 as of December 31, 2023
as a result of the recent drop in
interest rates which drove a $21.3
million increase in our accumulated
other comprehensive income (loss)
which was coupled with strong
earnings retention
Through calendar year 2024,
assuming published 2024 EPS
consensus estimates, current
dividend levels, and the estimated
reversal of unrealized losses on
AFS securities based on interest
rates as of December 31, 2023, our
goal is to grow TBVPS at a rate in-
line with, or more than, its growth
from 2007 to our IPO
НН
2008 2009 2010
2017 2018 3Q19
2019 2020 2021 2022 2023
¹ For reconciliation with GAAP metric, see "Non-GAAP reconciliations" in Appendix; 2 In 2019, HBT Financial issued and sold 9,429,794 shares of common stock at a price of $16 per
share. Total proceeds received by the Company, net of offering costs, were $138.5 million and were used to substantially fund a $170 million special dividend to stockholders of record
prior to the initial public offering. Amount reflects dilution per share attributable to newly issued shares in initial public offering and special dividend payment. For reconciliation with GAAP
metric, see "Non-GAAP reconciliations"; 3 Excludes dividends paid to S Corp shareholders for estimated tax liability prior to conversion to C Corp status on October 11, 2019. Excludes
$170 million special dividend funded primarily from IPO proceeds. For reconciliation with GAAP metric, see "Non-GAAP reconciliations" in Appendix.
21View entire presentation