HBT Financial Results Presentation Deck
2 Strong, granular, low-cost deposit base. ..
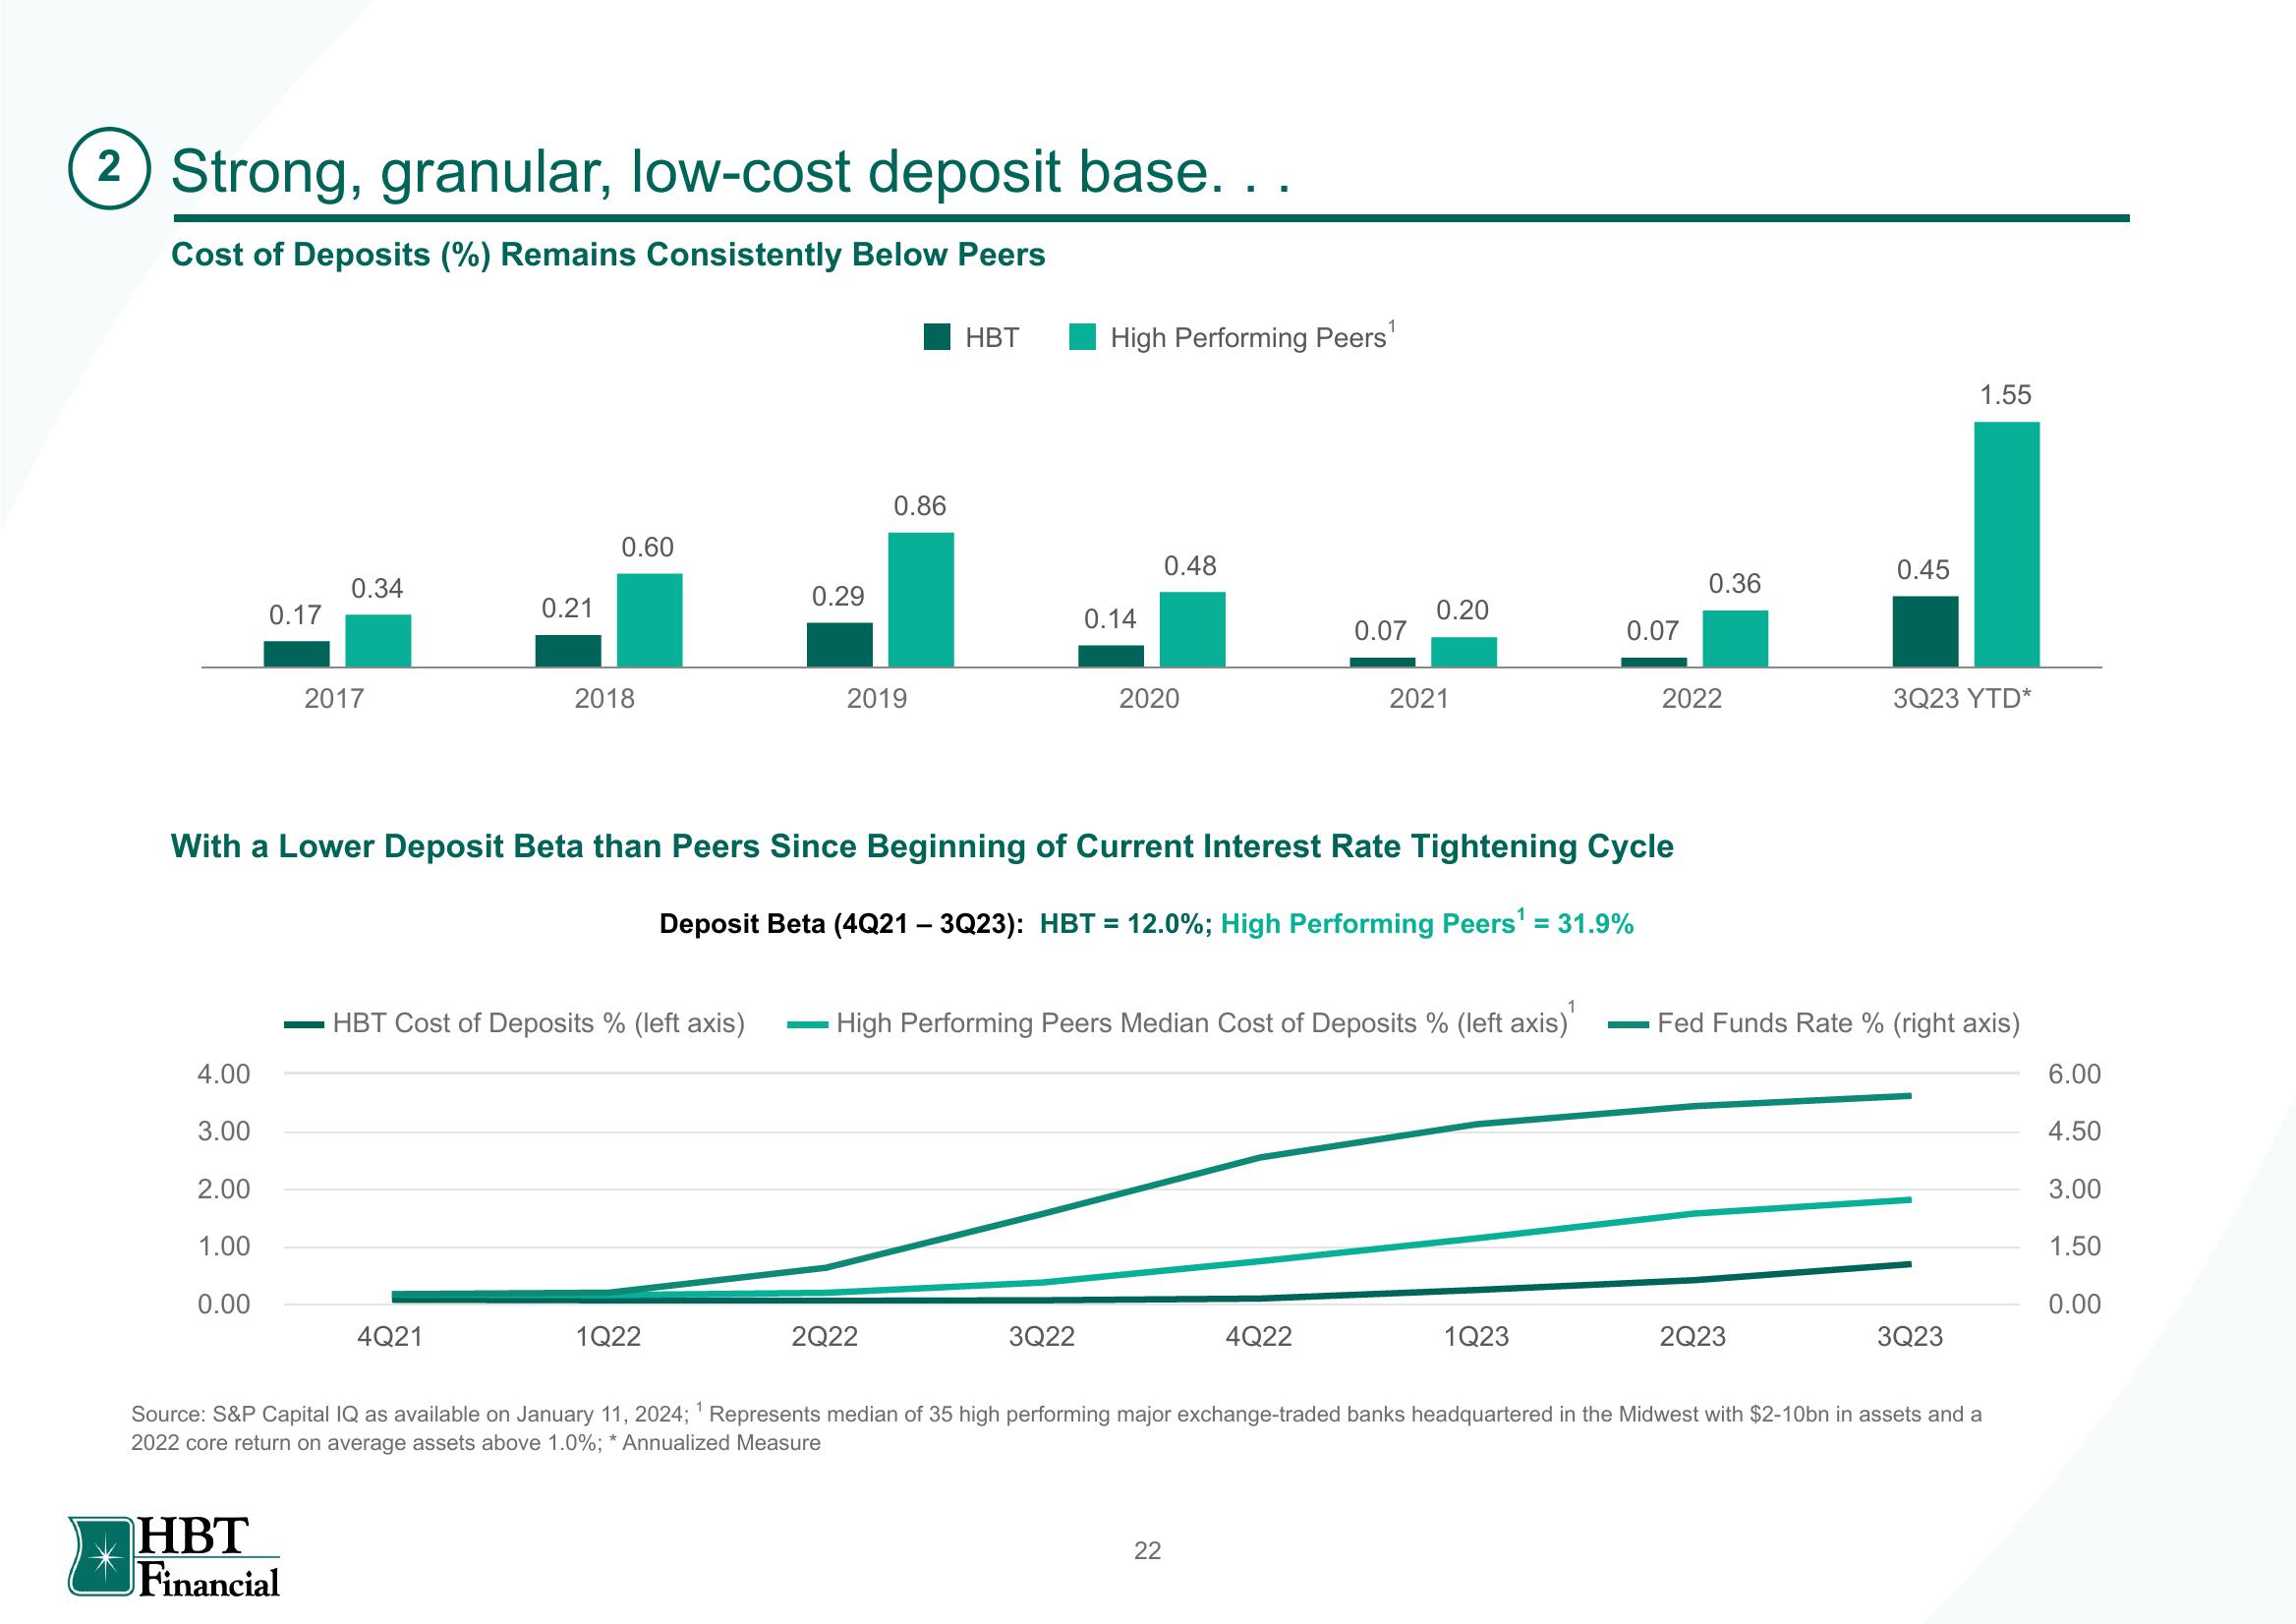
Cost of Deposits (%) Remains Consistently Below Peers
4.00
3.00
2.00
0.17
1.00
0.00
0.34
2017
HBT
Financial
0.21
0.60
4Q21
2018
HBT Cost of Deposits % (left axis)
0.29
1Q22
0.86
2019
HBT
2Q22
High Performing Peers¹
With a Lower Deposit Beta than Peers Since Beginning of Current Interest Rate Tightening Cycle
Deposit Beta (4Q21 - 3Q23): HBT = 12.0%; High Performing Peers¹ = 31.9%
0.14
3Q22
0.48
2020
0.07
High Performing Peers Median Cost of Deposits % (left axis)¹
22
0.20
4Q22
2021
0.07
1Q23
0.36
2022
0.45
2Q23
1.55
3Q23 YTD*
Fed Funds Rate % (right axis)
3Q23
Source: S&P Capital IQ as available on January 11, 2024; ¹ Represents median of 35 high performing major exchange-traded banks headquartered in the Midwest with $2-10bn in assets and a
2022 core return on average assets above 1.0%; * Annualized Measure
6.00
4.50
3.00
1.50
0.00View entire presentation