Rally SPAC Presentation Deck
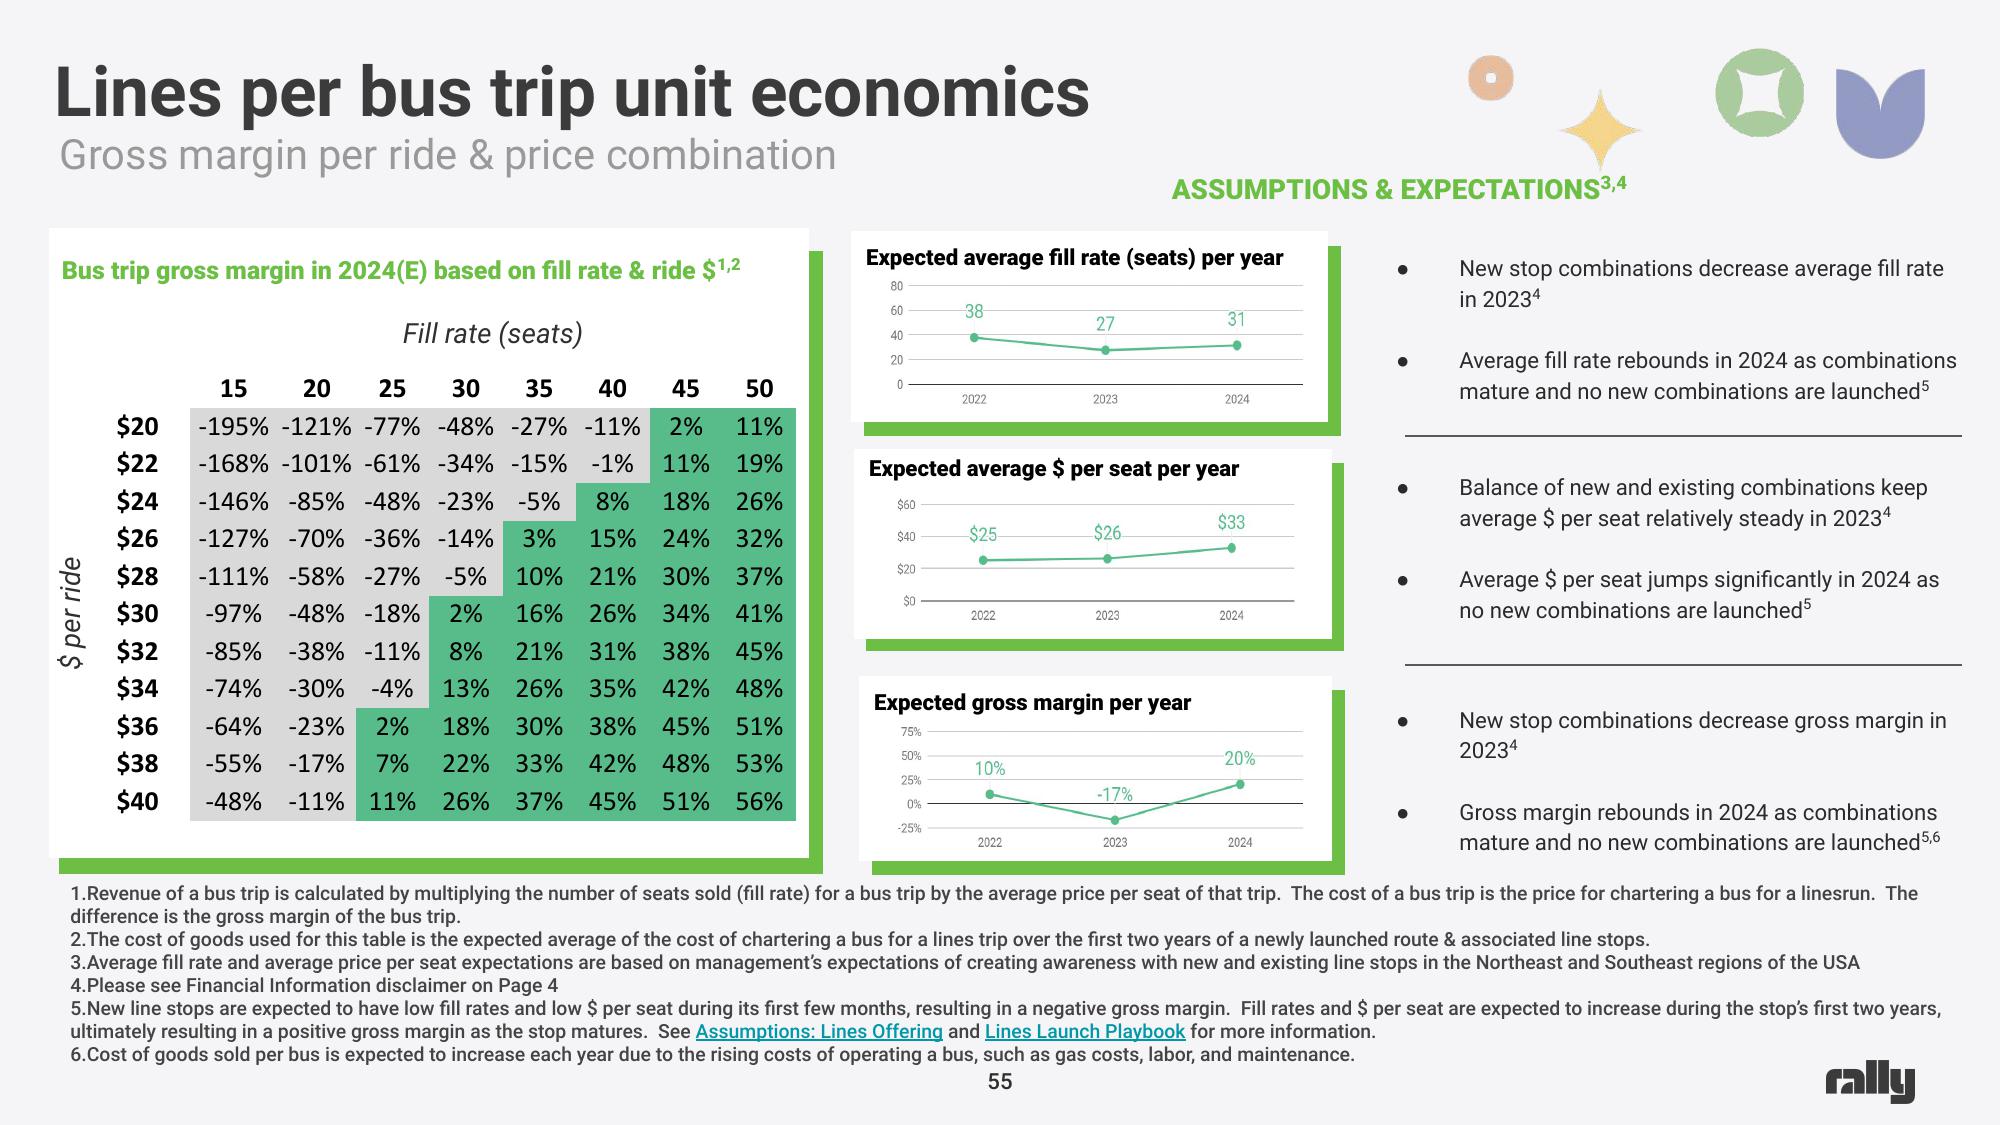
Lines per bus trip unit economics
Gross margin per ride & price combination
Bus trip gross margin in 2024(E) based on fill rate & ride $1,2
Fill rate (seats)
$20
$22
15 20 25 30 35 40 45 50
-195% -121 % -77% -48% -27% -11% 2% 11%
-168% -101% -61% -34% -15% -1% 11% 19%
$24
-146% -85% -48% -23% -5% 8% 18% 26%
$26 -127% -70% -36% -14% 3% 15% 24% 32%
$28 -111% -58% -27% -5% 10% 21% 30% 37%
$30 -97% -48% -18% 2% 16% 26% 34% 41%
$32 -85%
21% 31% 38% 45%
$34 -74% -30% -4% 13% 26% 35% 42% 48%
-64% -23% 2% 18% 30% 38% 45% 51%
-55% -17% 7% 22% 33% 42% 48% 53%
-48% -11% 11% 26% 37% 45% 51% 56%
-38% -11% 8%
$36
$38
$40
$ per ride
Expected average fill rate (seats) per year
80
60
40
20
0
38
6
$O
2022
$25
2022
27
Expected average $ per seat per year
$60
$40
$20
10%
●
2023
2022
$26
●
2023
Expected gross margin per year
75%
50%
25%
0%
-25%
ASSUMPTIONS & EXPECTATIONS3,4
-17%
2023
31
●
2024
$33
●
2024
-20%
2024
●
●
New stop combinations decrease average fill rate
in 20234
Average fill rate rebounds in 2024 as combinations
mature and no new combinations are launched 5
Balance of new and existing combinations keep
average $ per seat relatively steady in 20234
Average $ per seat jumps significantly in 2024 as
no new combinations are launched5
New stop combinations decrease gross margin in
20234
Gross margin rebounds in 2024 as combinations
mature and no new combinations are launched 5,6
1.Revenue of a bus trip is calculated by multiplying the number of seats sold (fill rate) for a bus trip by the average price per seat of that trip. The cost of a bus trip is the price for chartering a bus for a linesrun. The
difference is the gross margin of the bus trip.
2.The cost of goods used for this table is the expected average of the cost of chartering a bus for a lines trip over the first two years of a newly launched route & associated line stops.
3.Average fill rate and average price per seat expectations are based on management's expectations of creating awareness with new and existing line stops in the Northeast and Southeast regions of the USA
4.Please see Financial Information disclaimer on Page 4
5.New line stops are expected to have low fill rates and low $ per seat during its first few months, resulting in a negative gross margin. Fill rates and $ per seat are expected to increase during the stop's first two years,
ultimately resulting in a positive gross margin as the stop matures. See Assumptions: Lines Offering and Lines Launch Playbook for more information.
6.Cost of goods sold per bus is expected to increase each year due to the rising costs of operating a bus, such as gas costs, labor, and maintenance.
55
rallyView entire presentation