Mondee SPAC
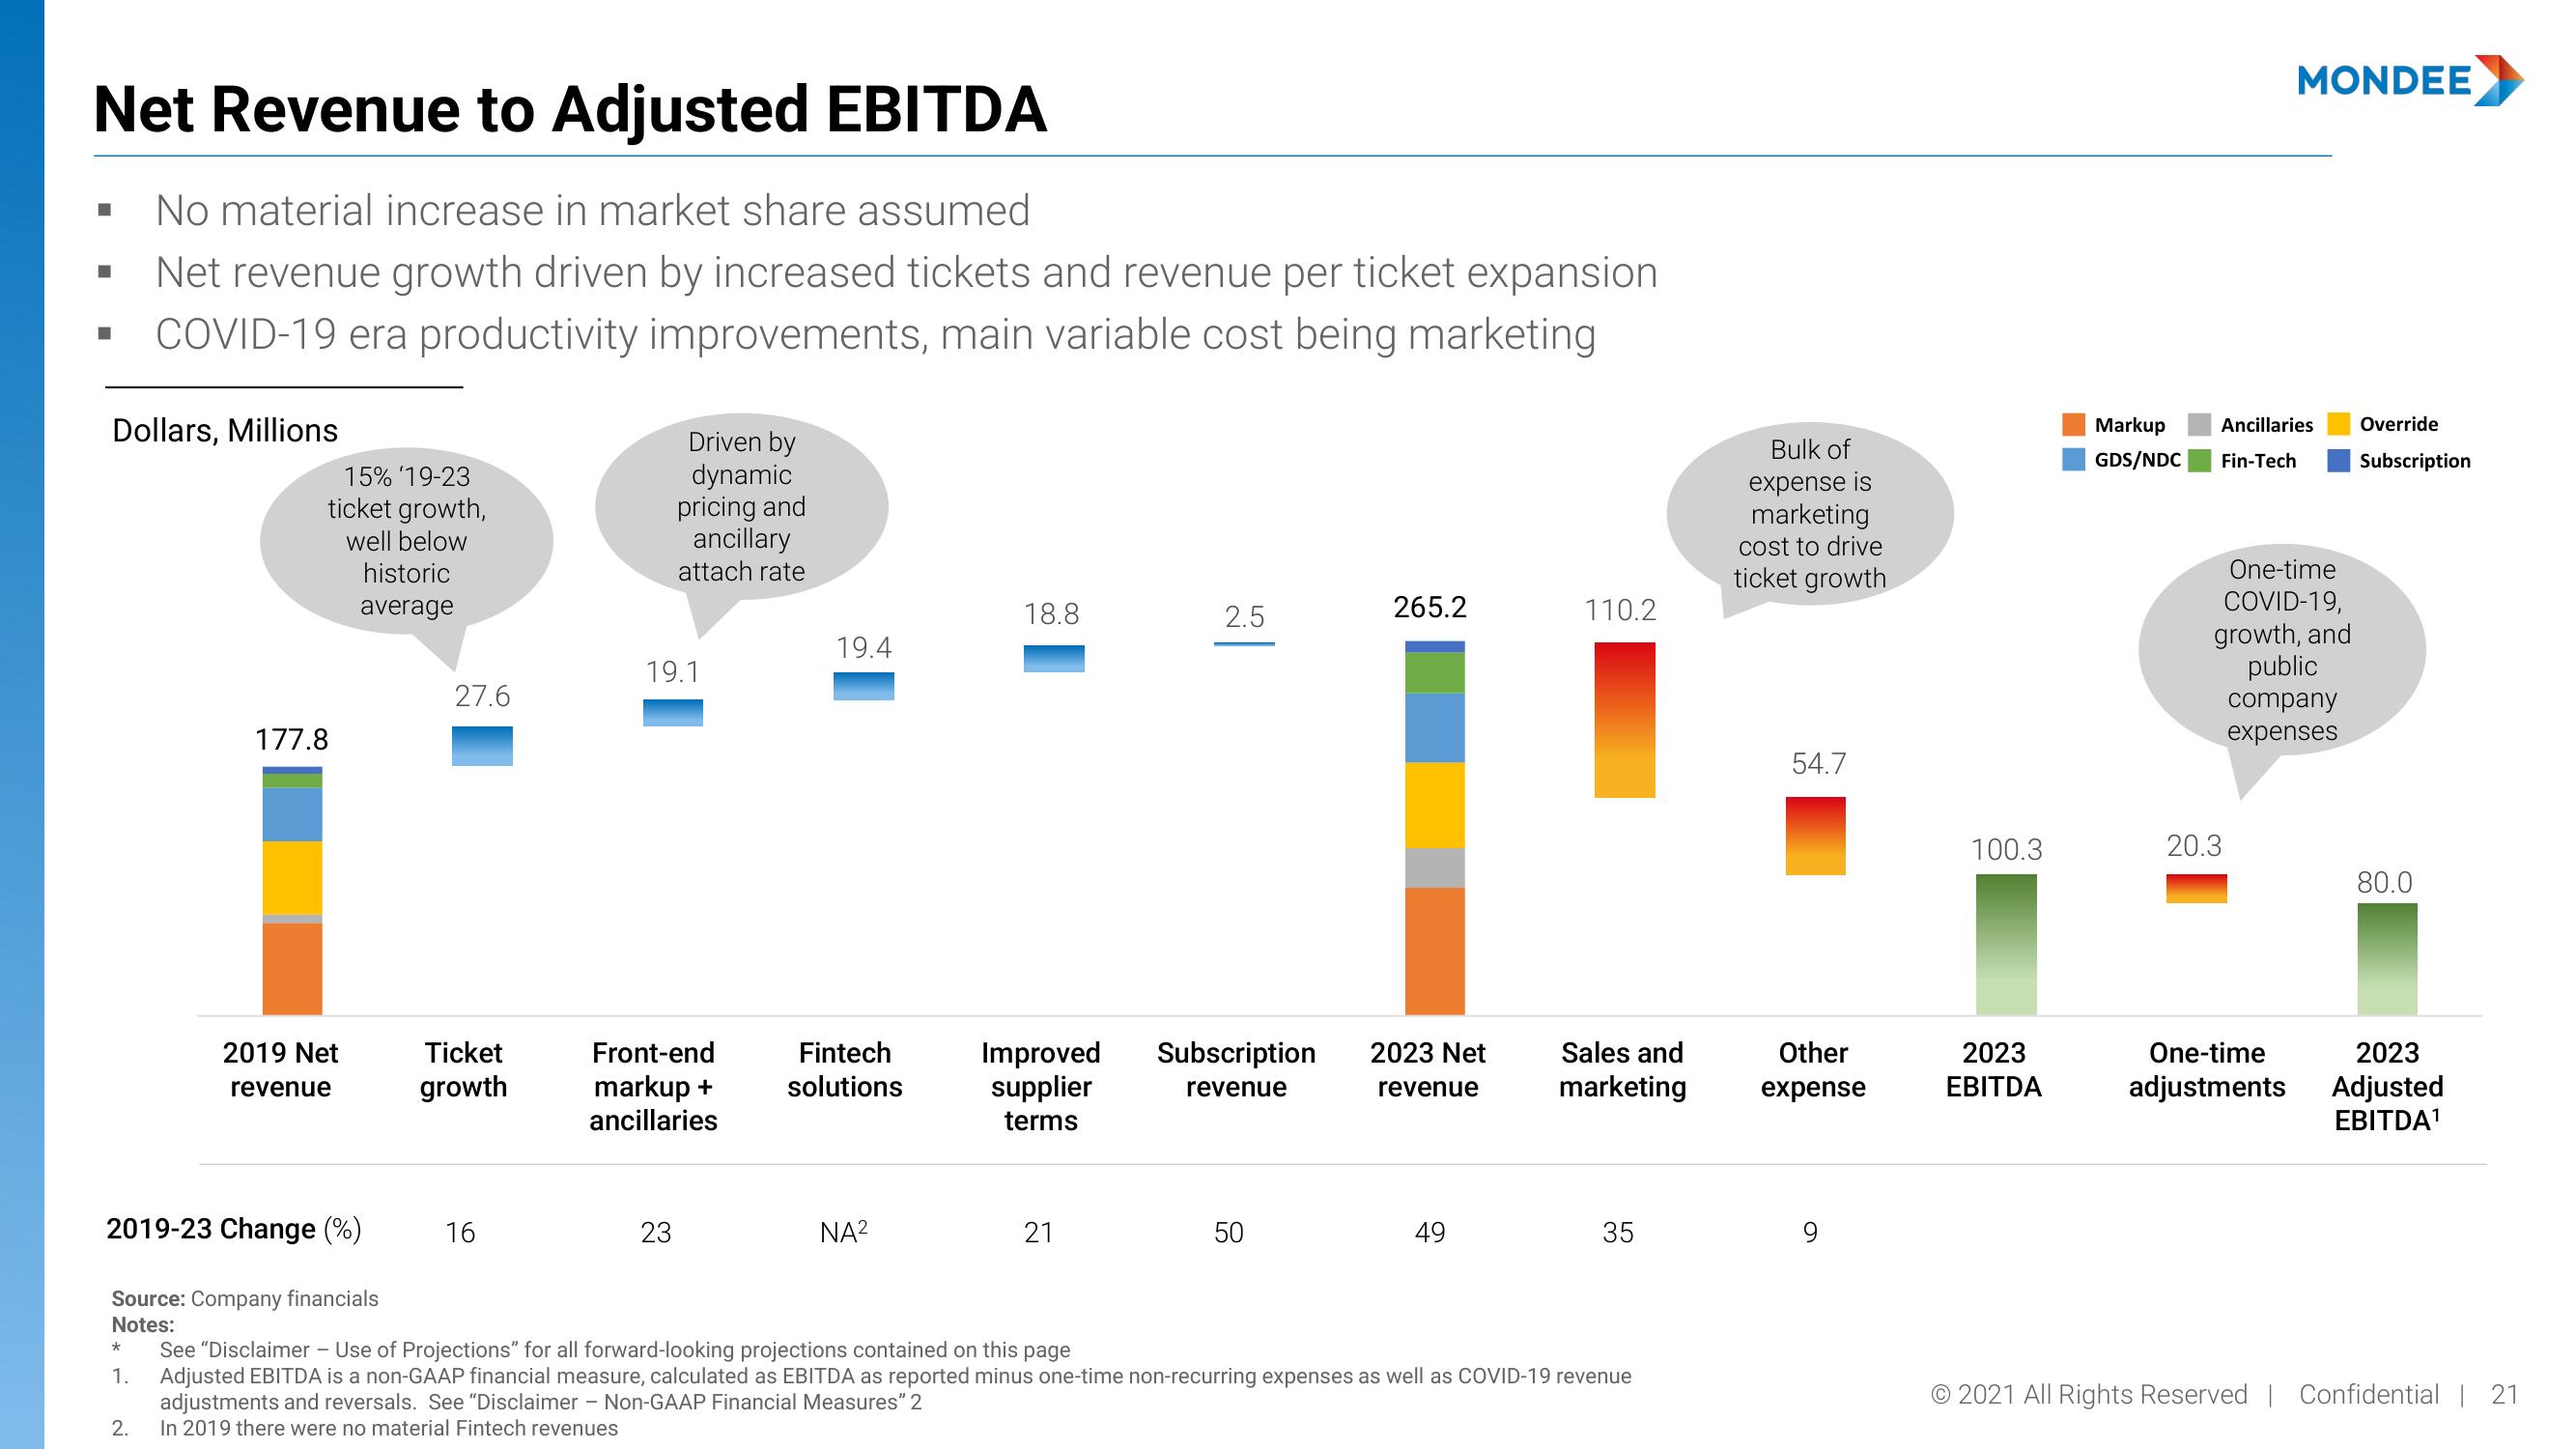
Net Revenue to Adjusted EBITDA
No material increase in market share assumed
Net revenue growth driven by increased tickets and revenue per ticket expansion
COVID-19 era productivity improvements, main variable cost being marketing
Dollars, Millions
*
15% '19-23
ticket growth,
well below
historic
average
2019-23 Change (%)
1.
177.8
Source: Company financials
Notes:
2.
2019 Net
revenue
27.6
Ticket
growth
16
Driven by
dynamic
pricing and
ancillary
attach rate
19.1
23
19.4
Front-end Fintech
markup + solutions
ancillaries
NA²
18.8
2.5
Improved Subscription
supplier
terms
revenue
21
50
265.2
2023 Net
revenue
49
110.2
Sales and
marketing
35
See "Disclaimer - Use of Projections" for all forward-looking projections contained on this page
Adjusted EBITDA is a non-GAAP financial measure, calculated as EBITDA as reported minus one-time non-recurring expenses as well as COVID-19 revenue
adjustments and reversals. See "Disclaimer - Non-GAAP Financial Measures" 2
In 2019 there were no material Fintech revenues
Bulk of
expense is
marketing
cost to drive
ticket growth
54.7
Other
expense
9
100.3
2023
EBITDA
Markup
GDS/NDC
Ancillaries
Fin-Tech
MONDEE
One-time
COVID-19,
growth, and
public
company
expenses
20.3
One-time
adjustments
Override
Subscription
80.0
2023
Adjusted
EBITDA¹
© 2021 All Rights Reserved | Confidential | 21View entire presentation