Maersk Results Presentation Deck
A.P. Moller Maersk Group
- Interim Report 02 2015
MAERSK OIL
Contents
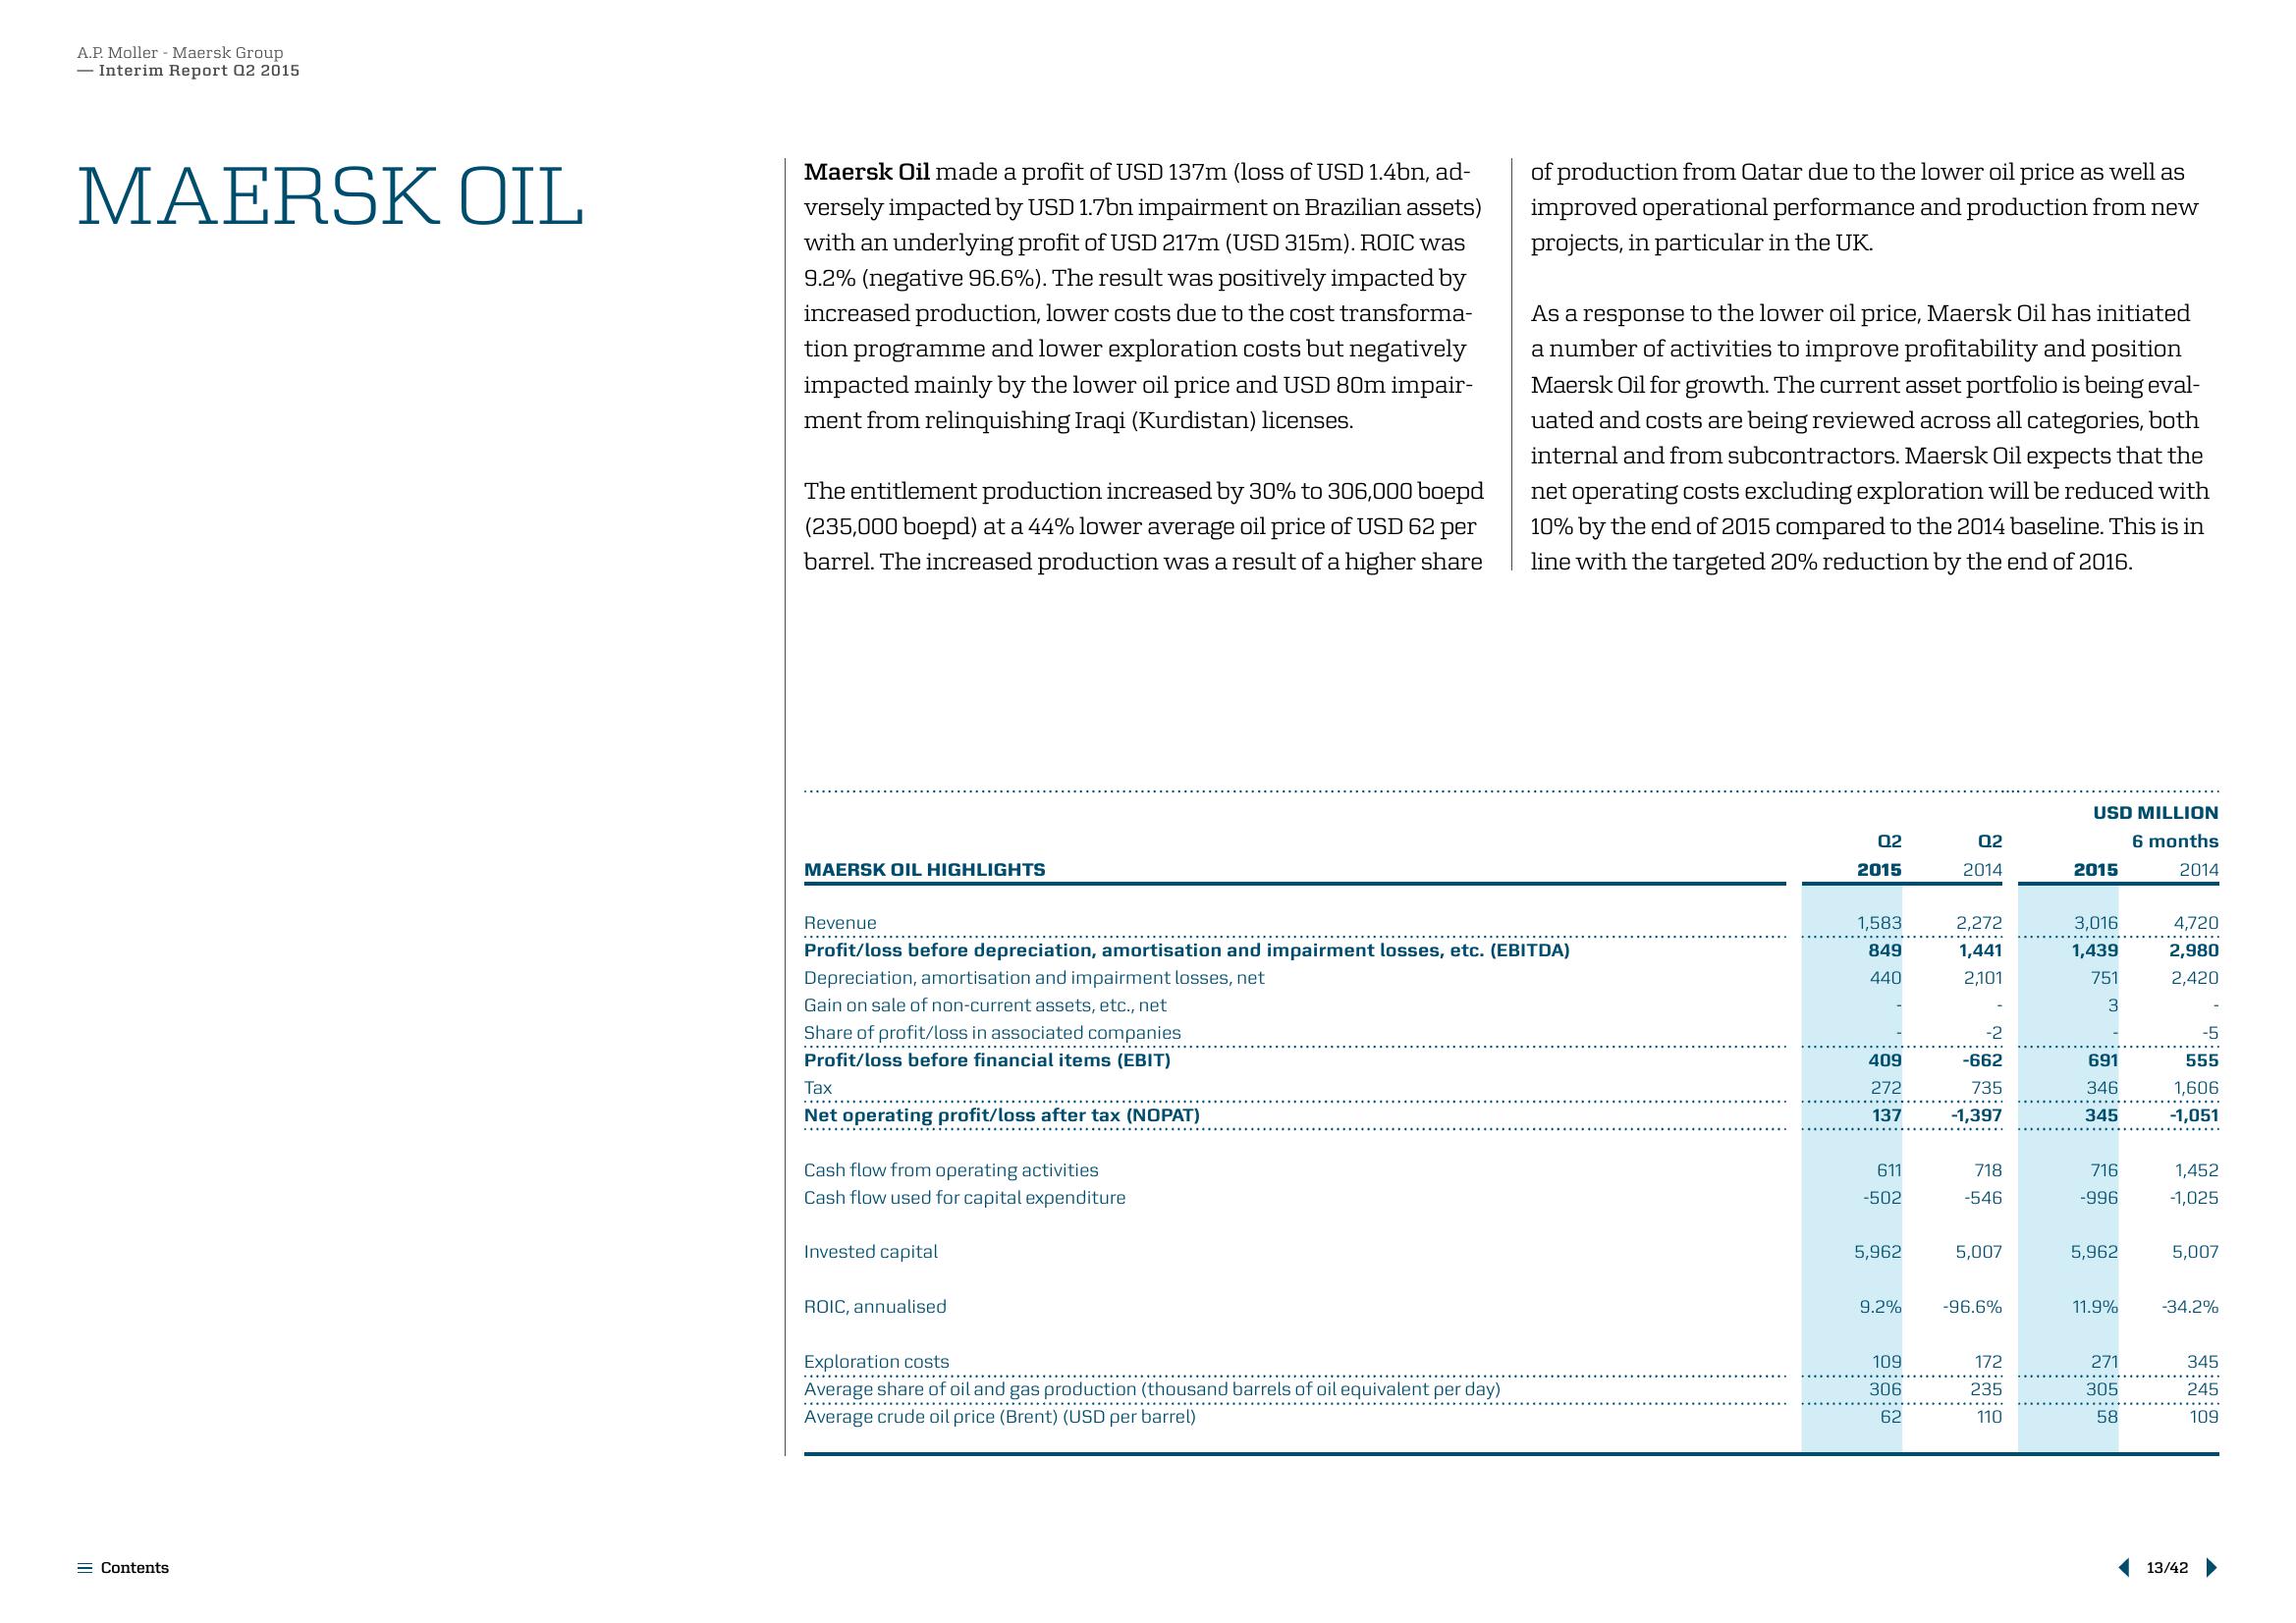
Maersk Oil made a profit of USD 137m (loss of USD 1.4bn, ad-
versely impacted by USD 1.7bn impairment on Brazilian assets)
with an underlying profit of USD 217m (USD 315m). ROIC was
9.2% (negative 96.6%). The result was positively impacted by
increased production, lower costs due to the cost transforma-
tion programme and lower exploration costs but negatively
impacted mainly by the lower oil price and USD 80m impair-
ment from relinquishing Iraqi (Kurdistan) licenses.
The entitlement production increased by 30% to 306,000 boepd
(235,000 boepd) at a 44% lower average oil price of USD 62 per
barrel. The increased production was a result of a higher share
MAERSK OIL HIGHLIGHTS
Revenue
**********
Tax
Net operating profit/loss after tax (NOPAT)
Profit/loss before depreciation, amortisation and impairment losses, etc. (EBITDA)
Depreciation, amortisation and impairment losses, net
Gain on sale of non-current assets, etc., net
Share of profit/loss in associated companies
Profit/loss before financial items (EBIT)
Cash flow from operating activities
Cash flow used for capital expenditure
Invested capital
ROIC, annualised
of production from Qatar due to the lower oil price as well as
improved operational performance and production from new
projects, in particular in the UK.
Exploration costs
Average share of oil and gas production (thousand barrels of oil equivalent per day)
Average crude oil price (Brent) (USD per barrel)
As a response to the lower oil price, Maersk Oil has initiated
a number of activities to improve profitability and position
Maersk Oil for growth. The current asset portfolio is being eval-
uated and costs are being reviewed across all categories, both
internal and from subcontractors. Maersk Oil expects that the
net operating costs excluding exploration will be reduced with
10% by the end of 2015 compared to the 2014 baseline. This is in
line with the targeted 20% reduction by the end of 2016.
02
2015
1,583
849
440
409
272
137
611
-502
5,962
9.2%
109
306
62
02
2014
2,272
1,441
2,101
-2
-662
735
-1,397
718
-546
5,007
-96.6%
172
235
110
USD MILLION
6 months
2014
2015
3,016
1,439
751
3
691
346
345
716
-996
5,962
11.9%
271
305
58
4,720
2,980
2,420
-5
555
1,606
-1,051
1,452
-1,025
5,007
-34.2%
345
245
109
13/42View entire presentation