Allwyn Results Presentation Deck
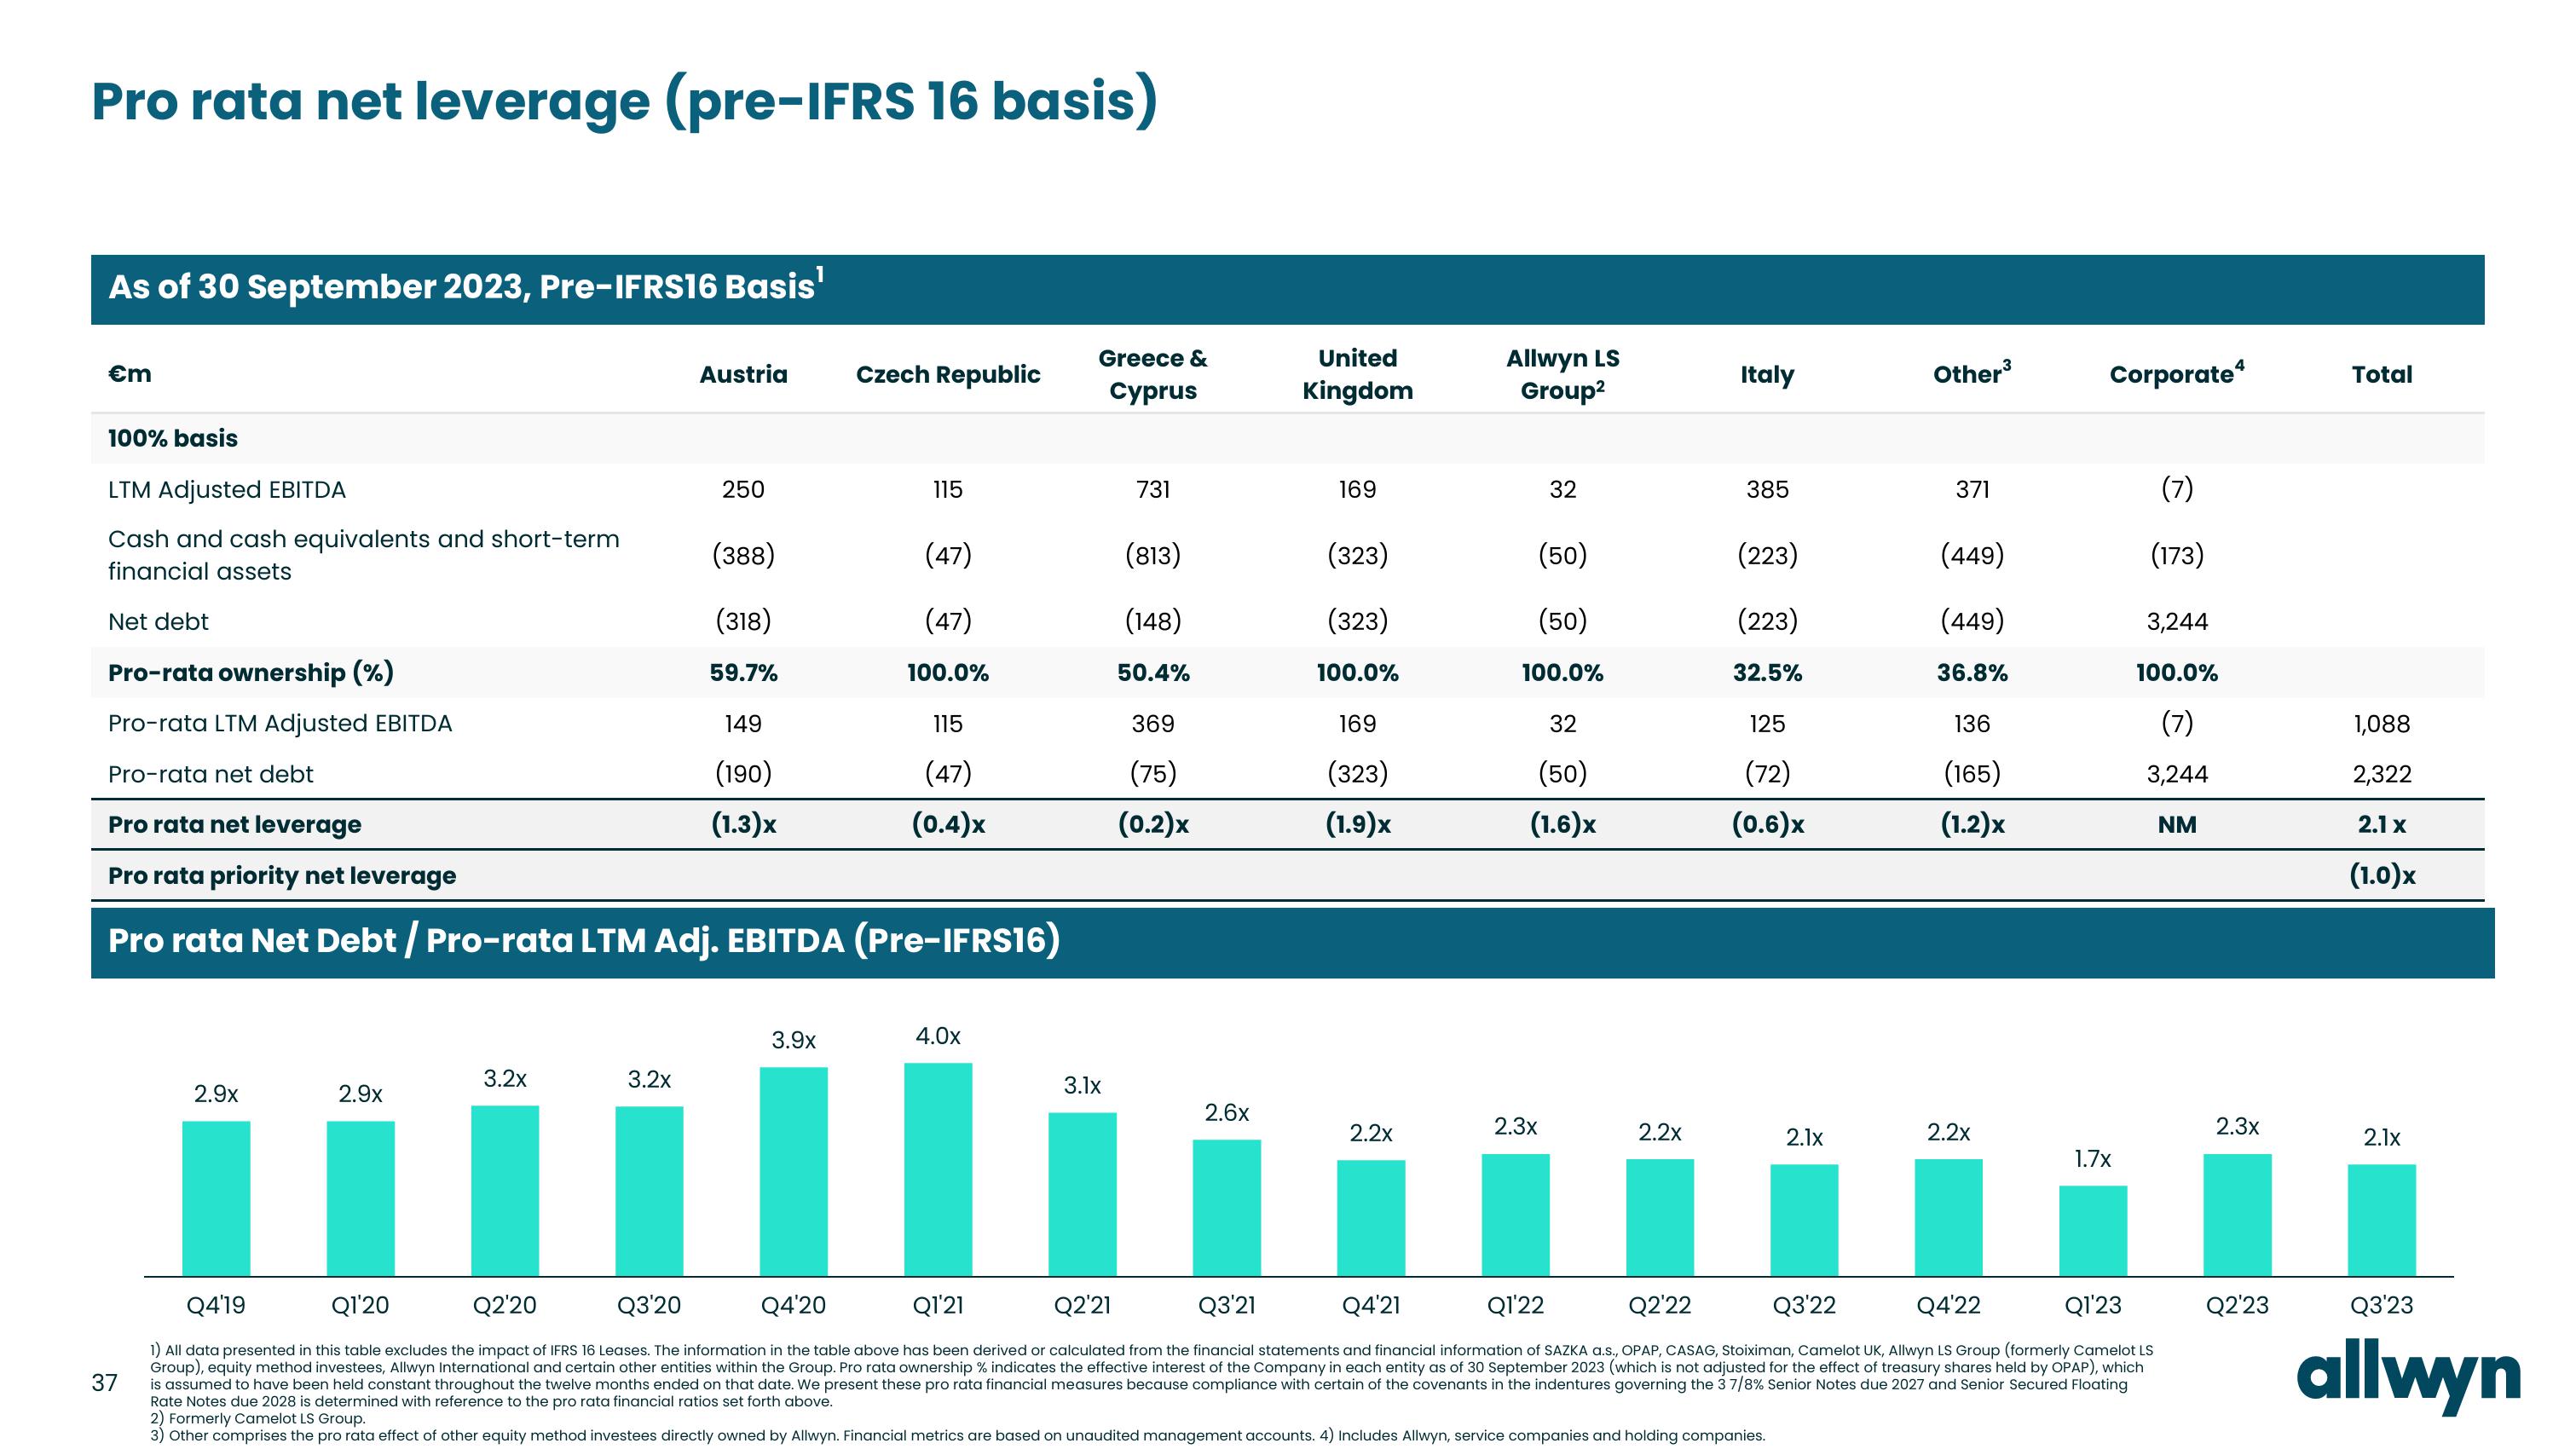
Pro rata net leverage (pre-IFRS 16 basis)
As of 30 September 2023, Pre-IFRS16 Basis¹
€m
100% basis
LTM Adjusted EBITDA
Cash and cash equivalents and short-term
financial assets
Net debt
Pro-rata ownership (%)
Pro-rata LTM Adjusted EBITDA
Pro-rata net debt
2.9x
2.9x
3.2x
Austria
3.2x
250
(388)
(318)
59.7%
149
(190)
(1.3)x
Pro rata net leverage
Pro rata priority net leverage
Pro rata Net Debt / Pro-rata LTM Adj. EBITDA (Pre-IFRS16)
Czech Republic
3.9x
115
(47)
(47)
100.0%
115
(47)
(0.4)x
4.0x
Greece &
Cyprus
3.1x
731
(813)
(148)
50.4%
369
(75)
(0.2)x
2.6x
United
Kingdom
169
(323)
(323)
100.0%
169
(323)
(1.9)x
2.2x
Allwyn LS
Group²
32
(50)
(50)
100.0%
32
(50)
(1.6)x
2.3x
2.2x
Italy
385
(223)
(223)
32.5%
125
(72)
(0.6)x
2.1x
Other³
371
(449)
(449)
36.8%
136
(165)
(1.2)x
2.2x
Corporate
1.7x
(7)
(173)
3,244
100.0%
(7)
3,244
NM
Q2'20
Q3'20
Q4'20
Q1'21
Q2'21
Q3'21
Q4'21
Q1'22
Q2'22
Q3'22
Q4'22
Q1'23
Q4'19
Q1'20
1) All data presented in this table excludes the impact of IFRS 16 Leases. The information in the table above has been derived or calculated from the financial statements and financial information of SAZKA a.s., OPAP, CASAG, Stoiximan, Camelot UK, Allwyn LS Group (formerly Camelot LS
Group), equity method investees, Allwyn International and certain other entities within the Group. Pro rata ownership % indicates the effective interest of the Company in each entity as of 30 September 2023 (which is not adjusted for the effect of treasury shares held by OPAP), which
is assumed to have been held constant throughout the twelve months ended on that date. We present these pro rata financial measures because compliance with certain of the covenants in the indentures governing the 3 7/8% Senior Notes due 2027 and Senior Secured Floating
Rate Notes due 2028 is determined with reference to the pro rata financial ratios set forth above.
37
2) Formerly Camelot LS Group.
3) Other comprises the pro rata effect of other equity method investees directly owned by Allwyn. Financial metrics are based on unaudited management accounts. 4) Includes Allwyn, service companies and holding companies.
2.3x
Q2'23
Total
1,088
2,322
2.1 x
(1.0)x
2.1x
Q3'23
allwynView entire presentation