Oatly Results Presentation Deck
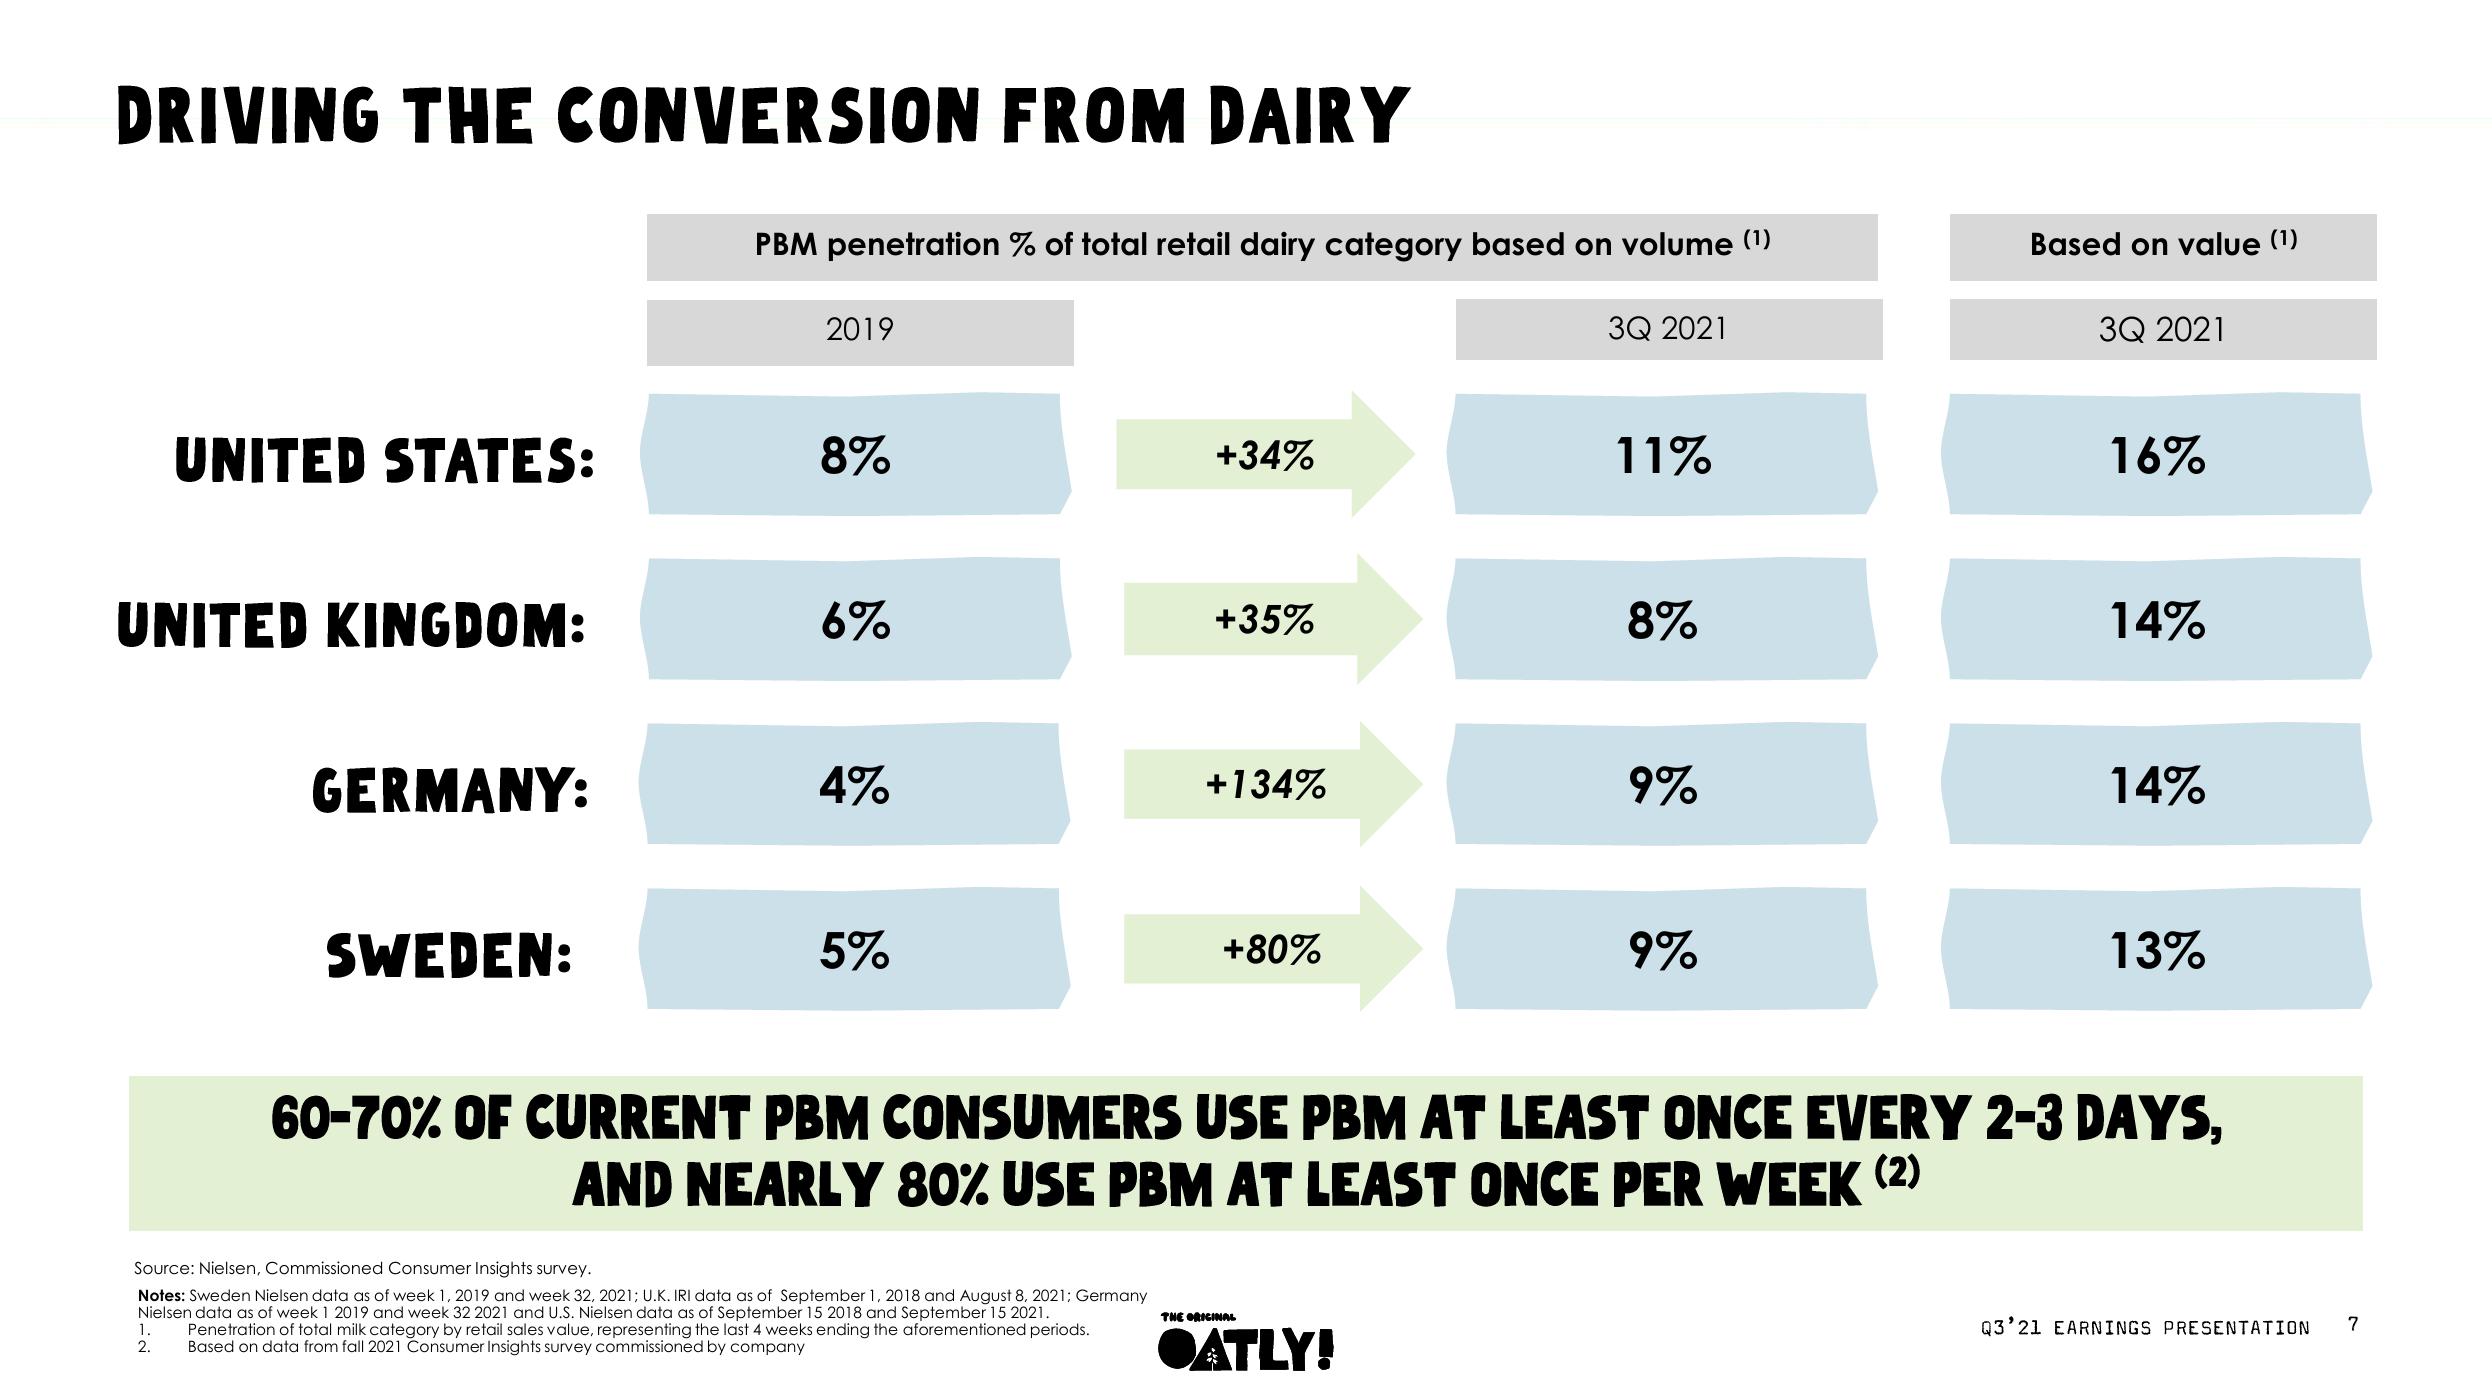
DRIVING THE CONVERSION FROM DAIRY
UNITED STATES:
UNITED KINGDOM:
1.
2.
GERMANY:
SWEDEN:
PBM penetration % of total retail dairy category based on volume (¹)
2019
8%
6%
4%
5%
Source: Nielsen, Commissioned Consumer Insights survey.
Notes: Sweden Nielsen data as of week 1, 2019 and week 32, 2021; U.K. IRI data as of September 1, 2018 and August 8, 2021; Germany
Nielsen data as of week 1 2019 and week 32 2021 and U.S. Nielsen data as of September 15 2018 and September 15 2021.
Penetration of total milk category by retail sales value, representing the last 4 weeks ending the aforementioned periods.
Based on data from fall 2021 Consumer Insights survey commissioned by company
+34%
+35%
+134%
+80%
3Q 2021
THE ORIGINAL
●ATLY!
11%
8%
9%
9%
Based on value (¹)
3Q 2021
16%
14%
14%
60-70% OF CURRENT PBM CONSUMERS USE PBM AT LEAST ONCE EVERY 2-3 DAYS,
AND NEARLY 80% USE PBM AT LEAST ONCE PER WEEK (²)
13%
Q3'21 EARNINGS PRESENTATION
7View entire presentation