HSBC Results Presentation Deck
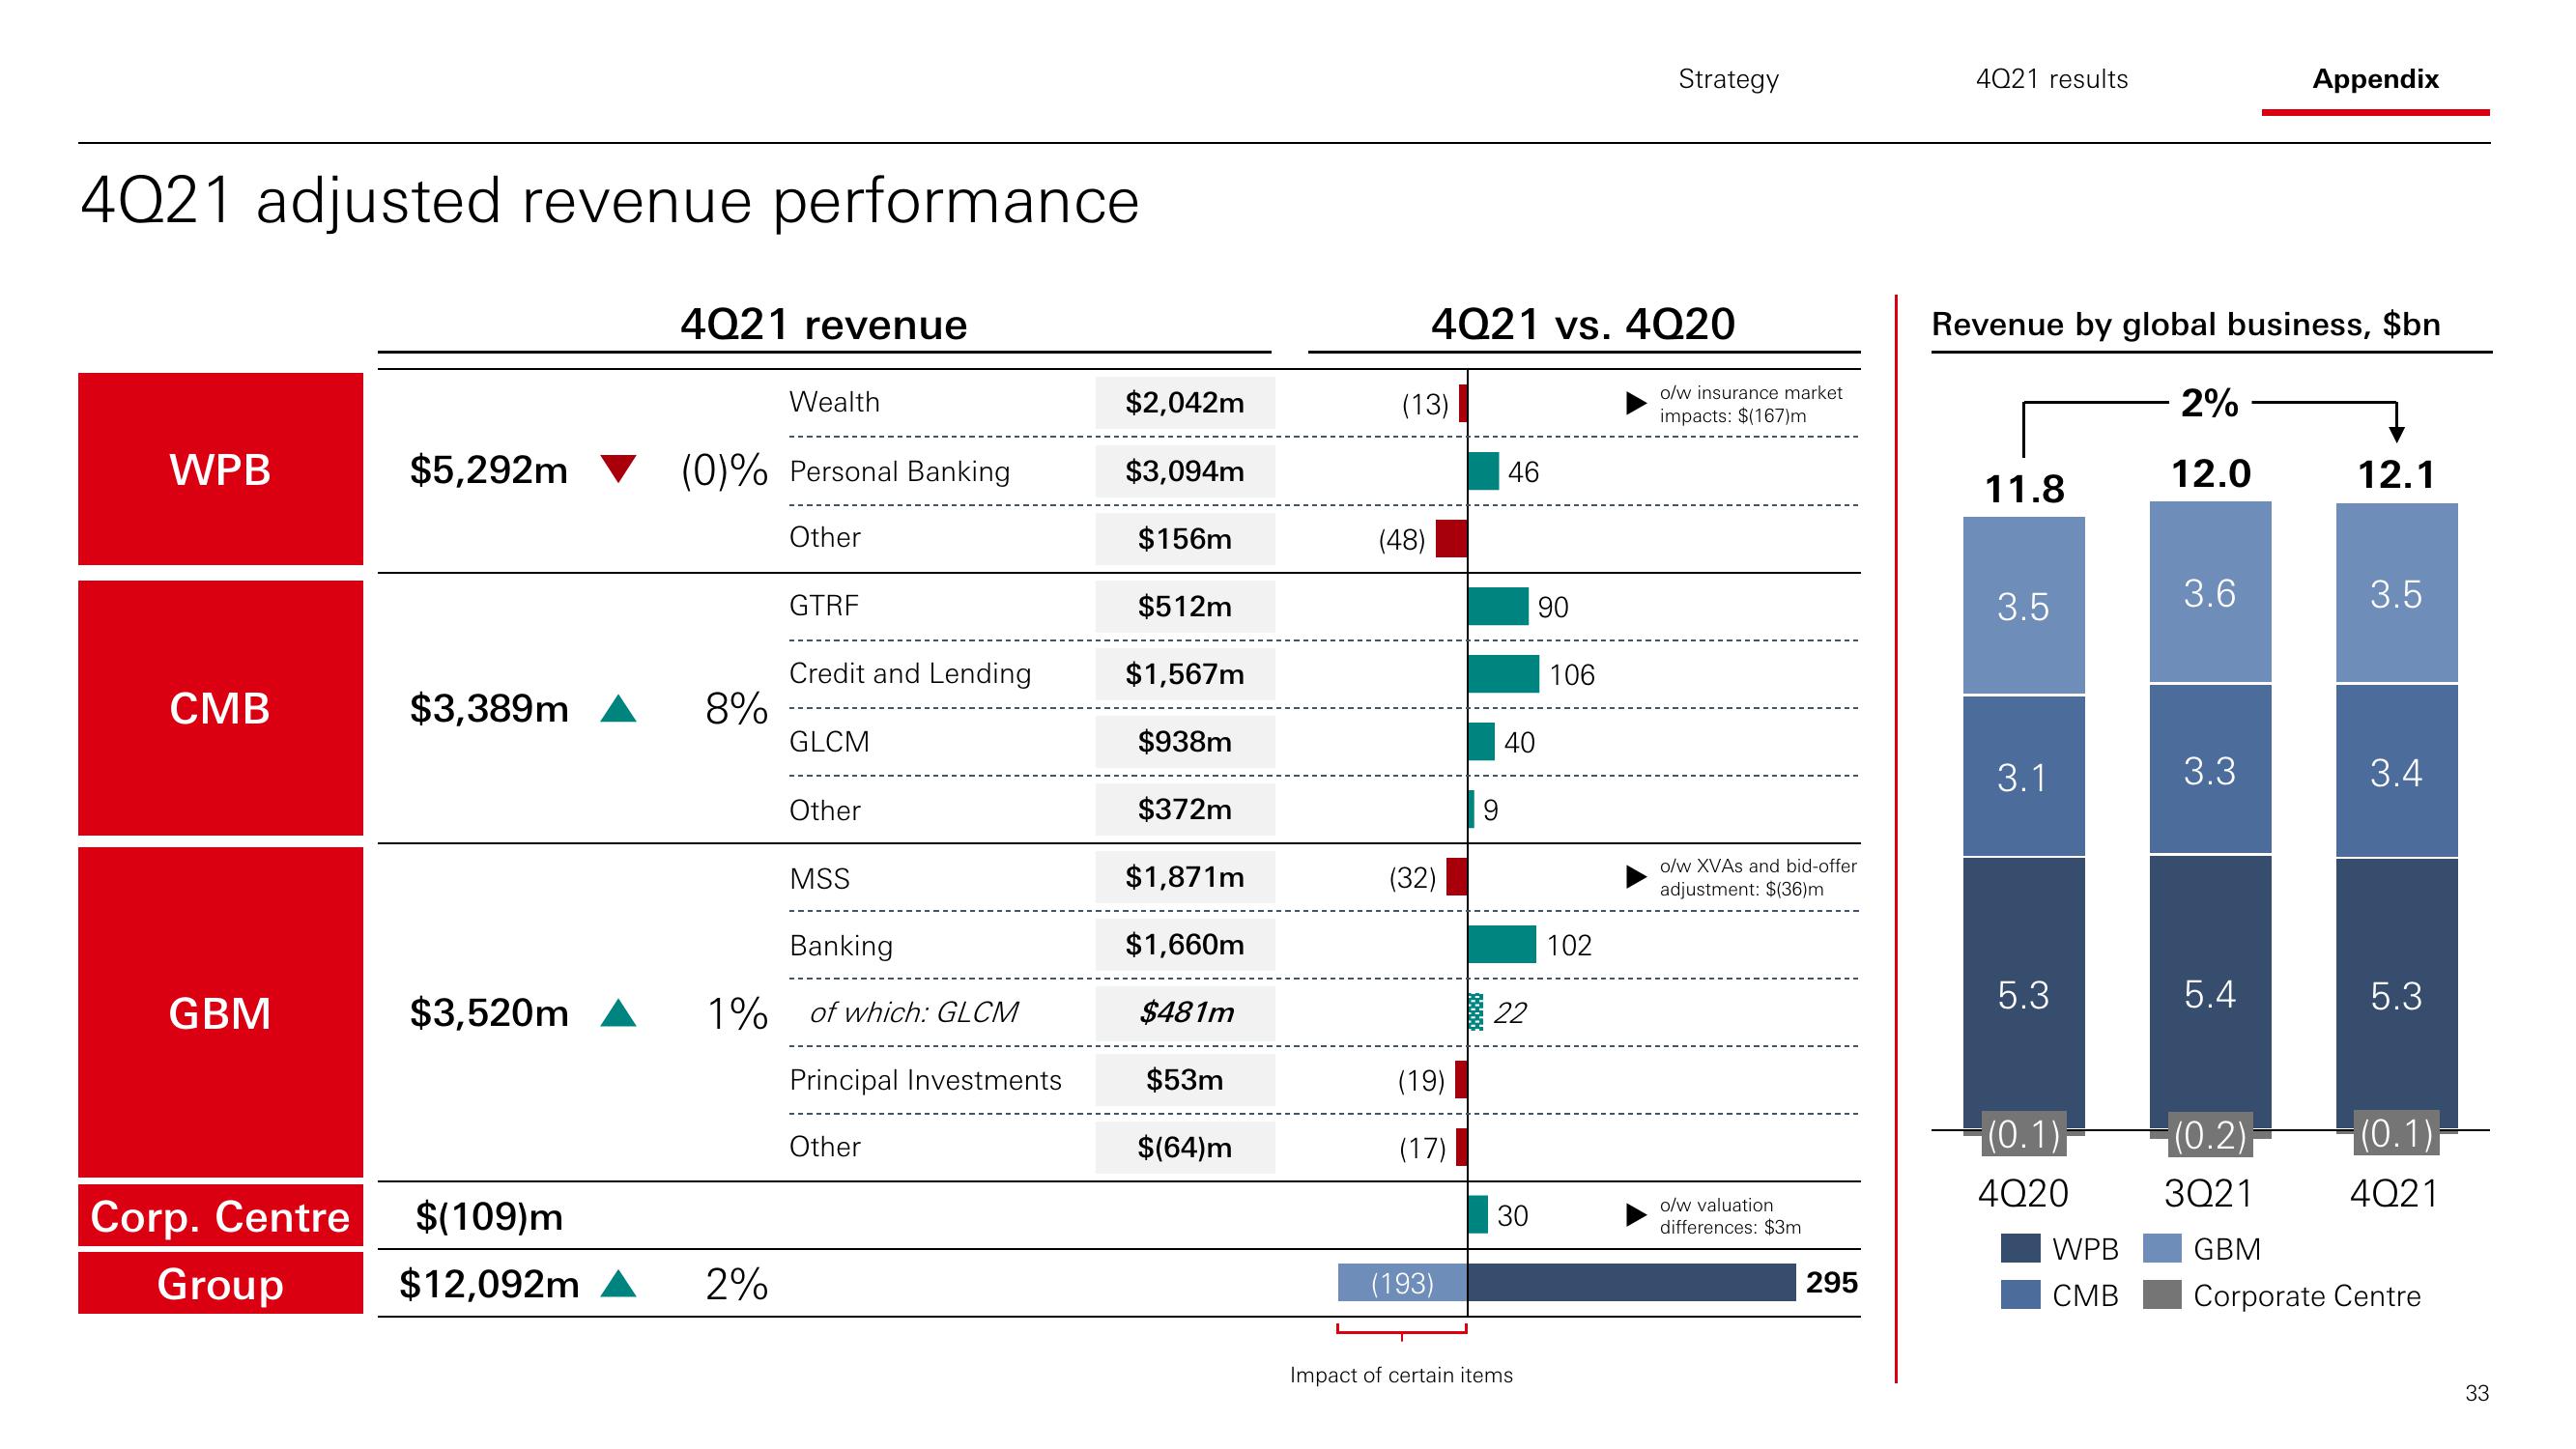
4021 adjusted revenue performance
WPB
CMB
GBM
Corp. Centre
Group
$5,292m
$3,389m
$3,520m
4021 revenue
(0)% Personal Banking
Other
8%
Wealth
$(109)m
$12,092m ▲ 2%
GTRF
Credit and Lending
GLCM
Other
MSS
Banking
1% of which: GLCM
Principal Investments
Other
$2,042m
$3,094m
$156m
$512m
$1,567m
$938m
$372m
$1,871m
$1,660m
$481m
$53m
$(64)m
(13)
(48)
4021 vs. 4020
(32)
(19)
(17)
(193)
9
46
40
22
30
Impact of certain items
90
106
Strategy
102
o/w insurance market
impacts: $(167)m
o/w XVAs and bid-offer
adjustment: $(36)m
o/w valuation
differences: $3m
295
4021 results
Revenue by global business, $bn
2%
12.0
11.8
3.5
3.1
5.3
(0.1)
4Q20
WPB
CMB
3.6
3.3
Appendix
5.4
12.1
3.5
3.4
5.3
(0.1)
4Q21
(0.2)
3Q21
GBM
Corporate Centre
33View entire presentation