Maersk Results Presentation Deck
Maersk Group
- Interim Report 03 2015
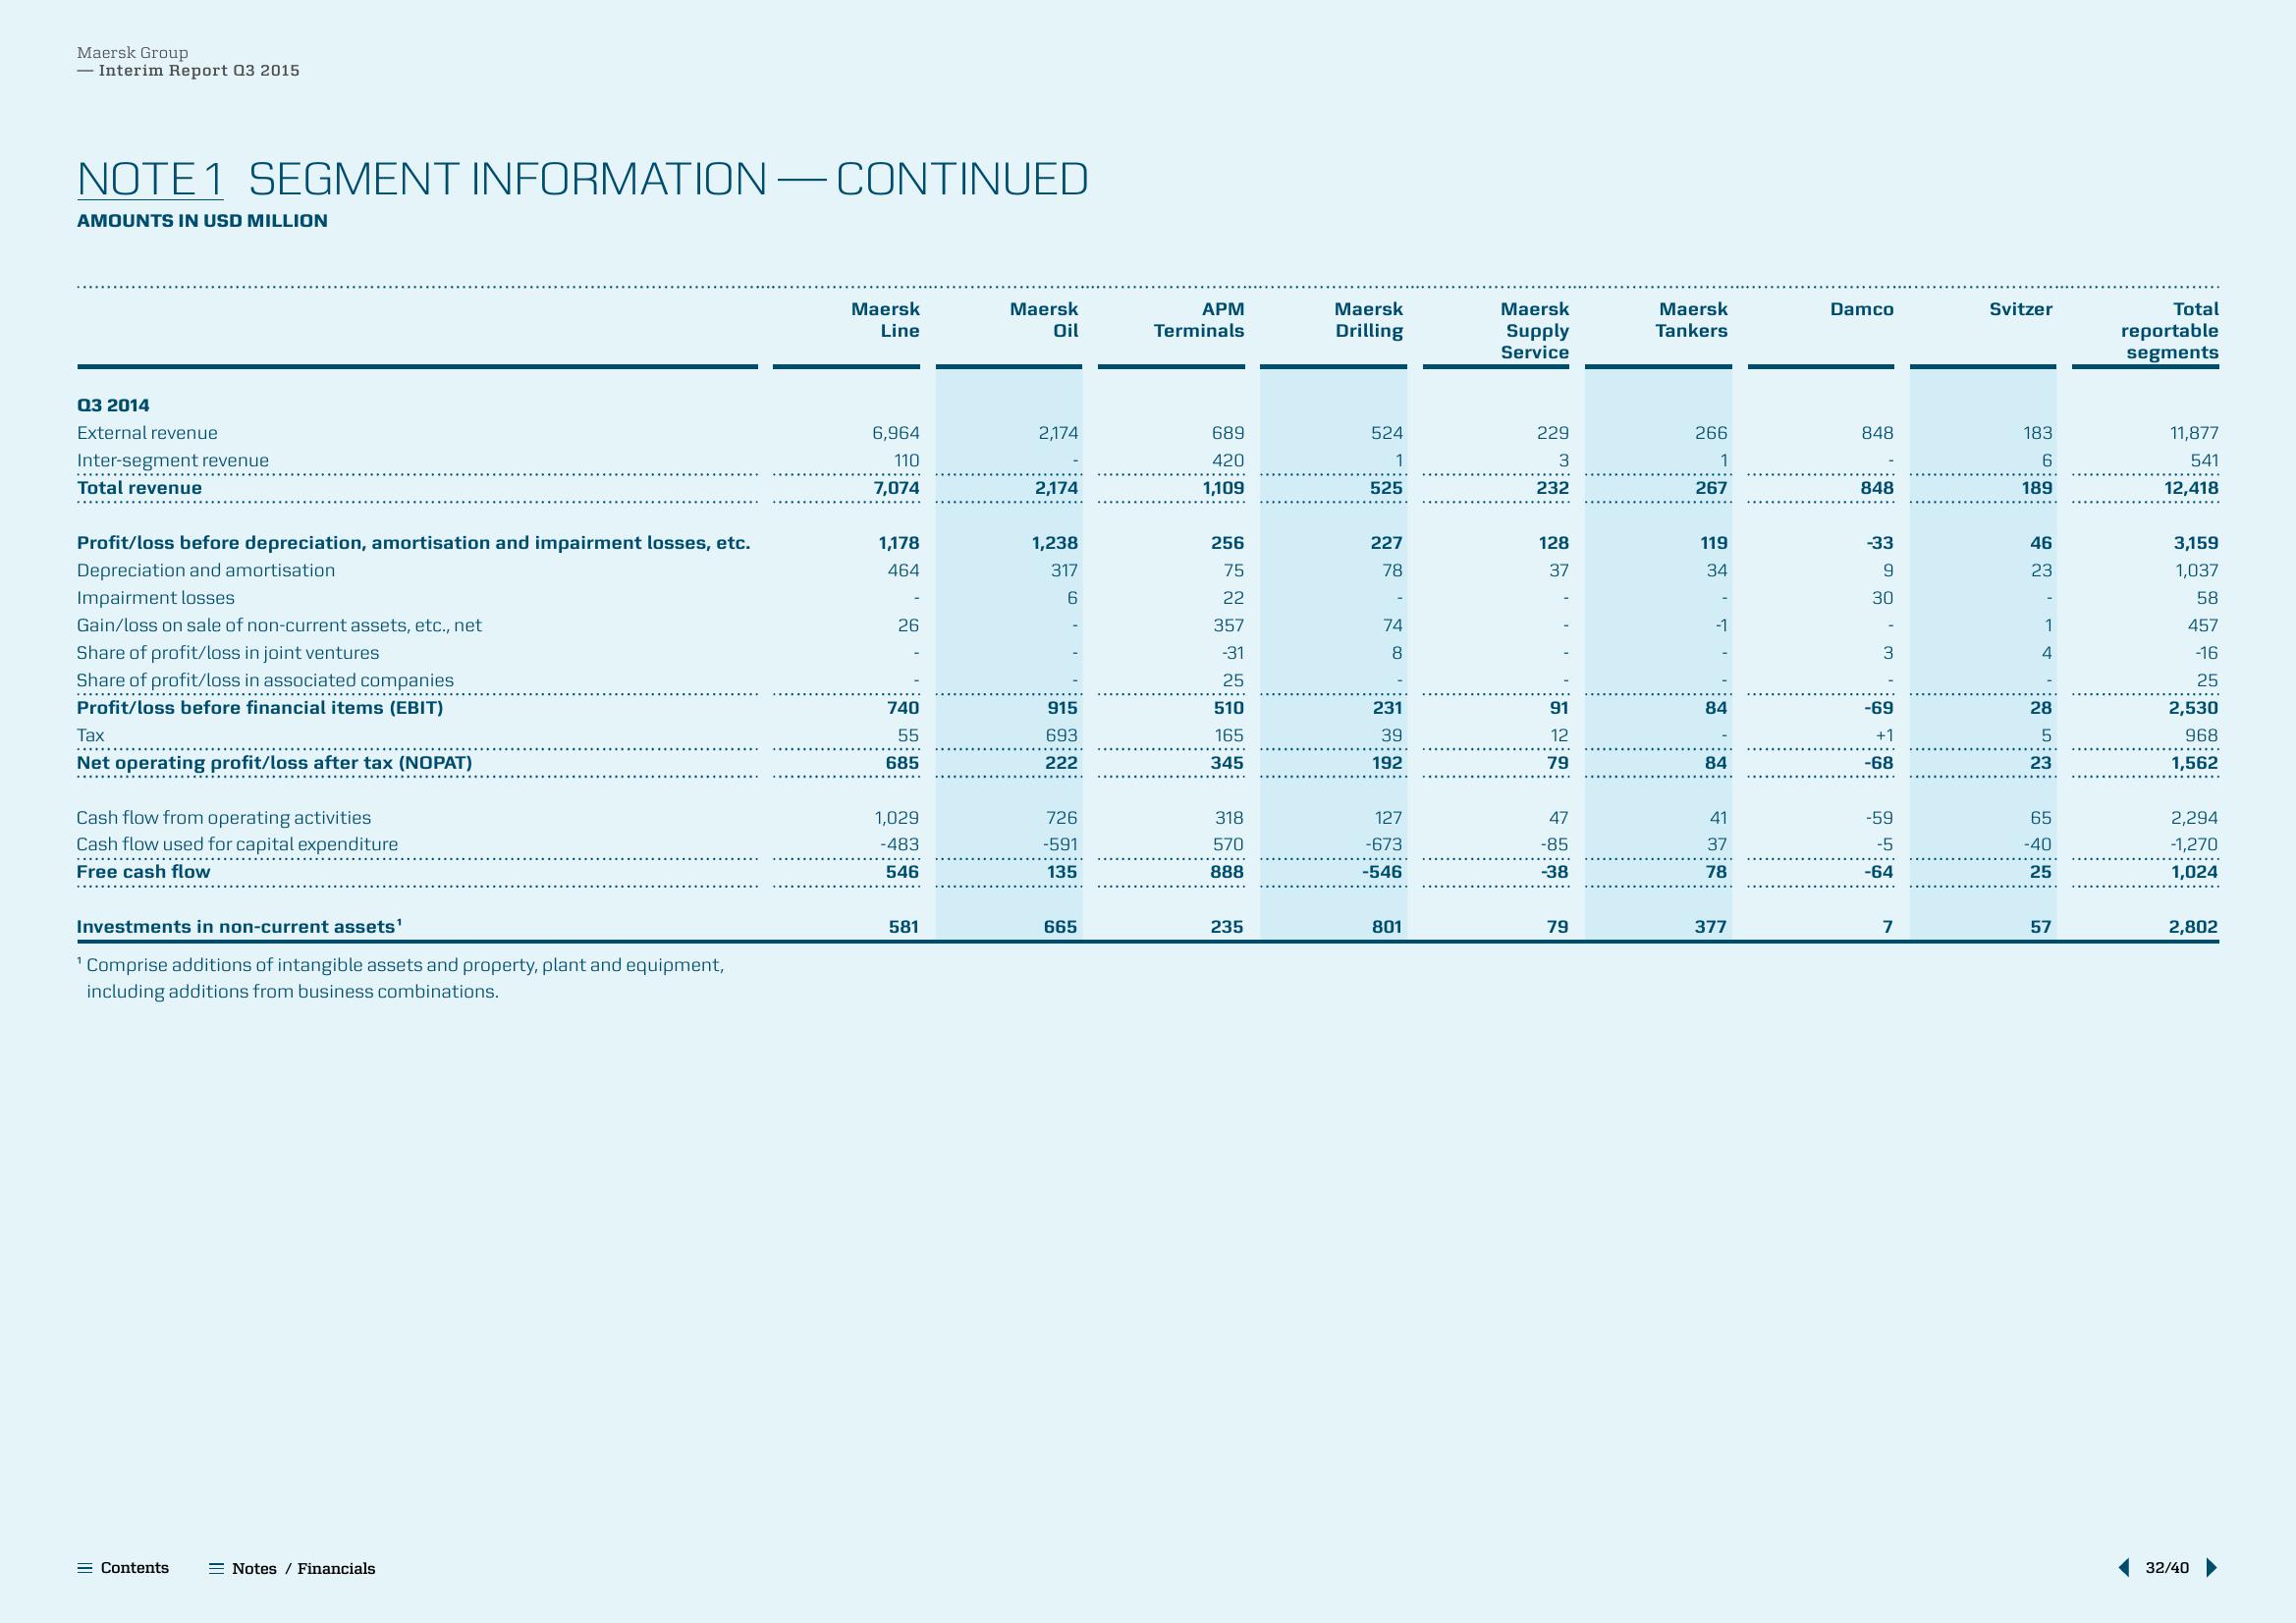
NOTE 1 SEGMENT INFORMATION — CONTINUED
AMOUNTS IN USD MILLION
Q3 2014
External revenue
Inter-segment revenue
Total revenue
Profit/loss before depreciation, amortisation and impairment losses, etc.
Depreciation and amortisation
Impairment losses
Gain/loss on sale of non-current assets, etc., net
Share of profit/loss in joint ventures
Share of profit/loss in associated companies
Profit/loss before financial items (EBIT)
**********…………………..
Tax
Net operating profit/loss after tax (NOPAT)
Cash flow from operating activities
Cash flow used for capital expenditure
Free cash flow
Investments in non-current assets¹
¹ Comprise additions of intangible assets and property, plant and equipment,
including additions from business combinations.
= Contents
Notes / Financials
Maersk
Line
6,964
110
7,074
1,178
464
26
740
55
685
1,029
-483
546
581
Maersk
Oil
2,174
2,174
1,238
317
6
915
693
222
726
-591
135
665
APM
Terminals
689
420
1,109
256
75
22
357
-31
25
510
165
345
318
570
888
235
Maersk
Drilling
524
1
525
227
78
-
74
co
8
231
39
192
127
-673
-546
801
Maersk
Supply
Service
229
3
232
128
37
91
12
79
47
-85
-38
79
Maersk
Tankers
266
1
267
119
34
-
-1
84
84
41
37
78
377
Damco
848
848
-33
9
30
3
-69
+1
-68
-59
-5
-64
7
Svitzer
183
6
189
46
23
1
4
28
5
23
65
-40
25
57
Total
reportable
segments
11,877
541
12,418
3,159
1,037
58
457
-16
25
2,530
968
1,562
2,294
-1,270
1,024
2,802
32/40View entire presentation