Antofagasta Investor Conference Presentation Deck
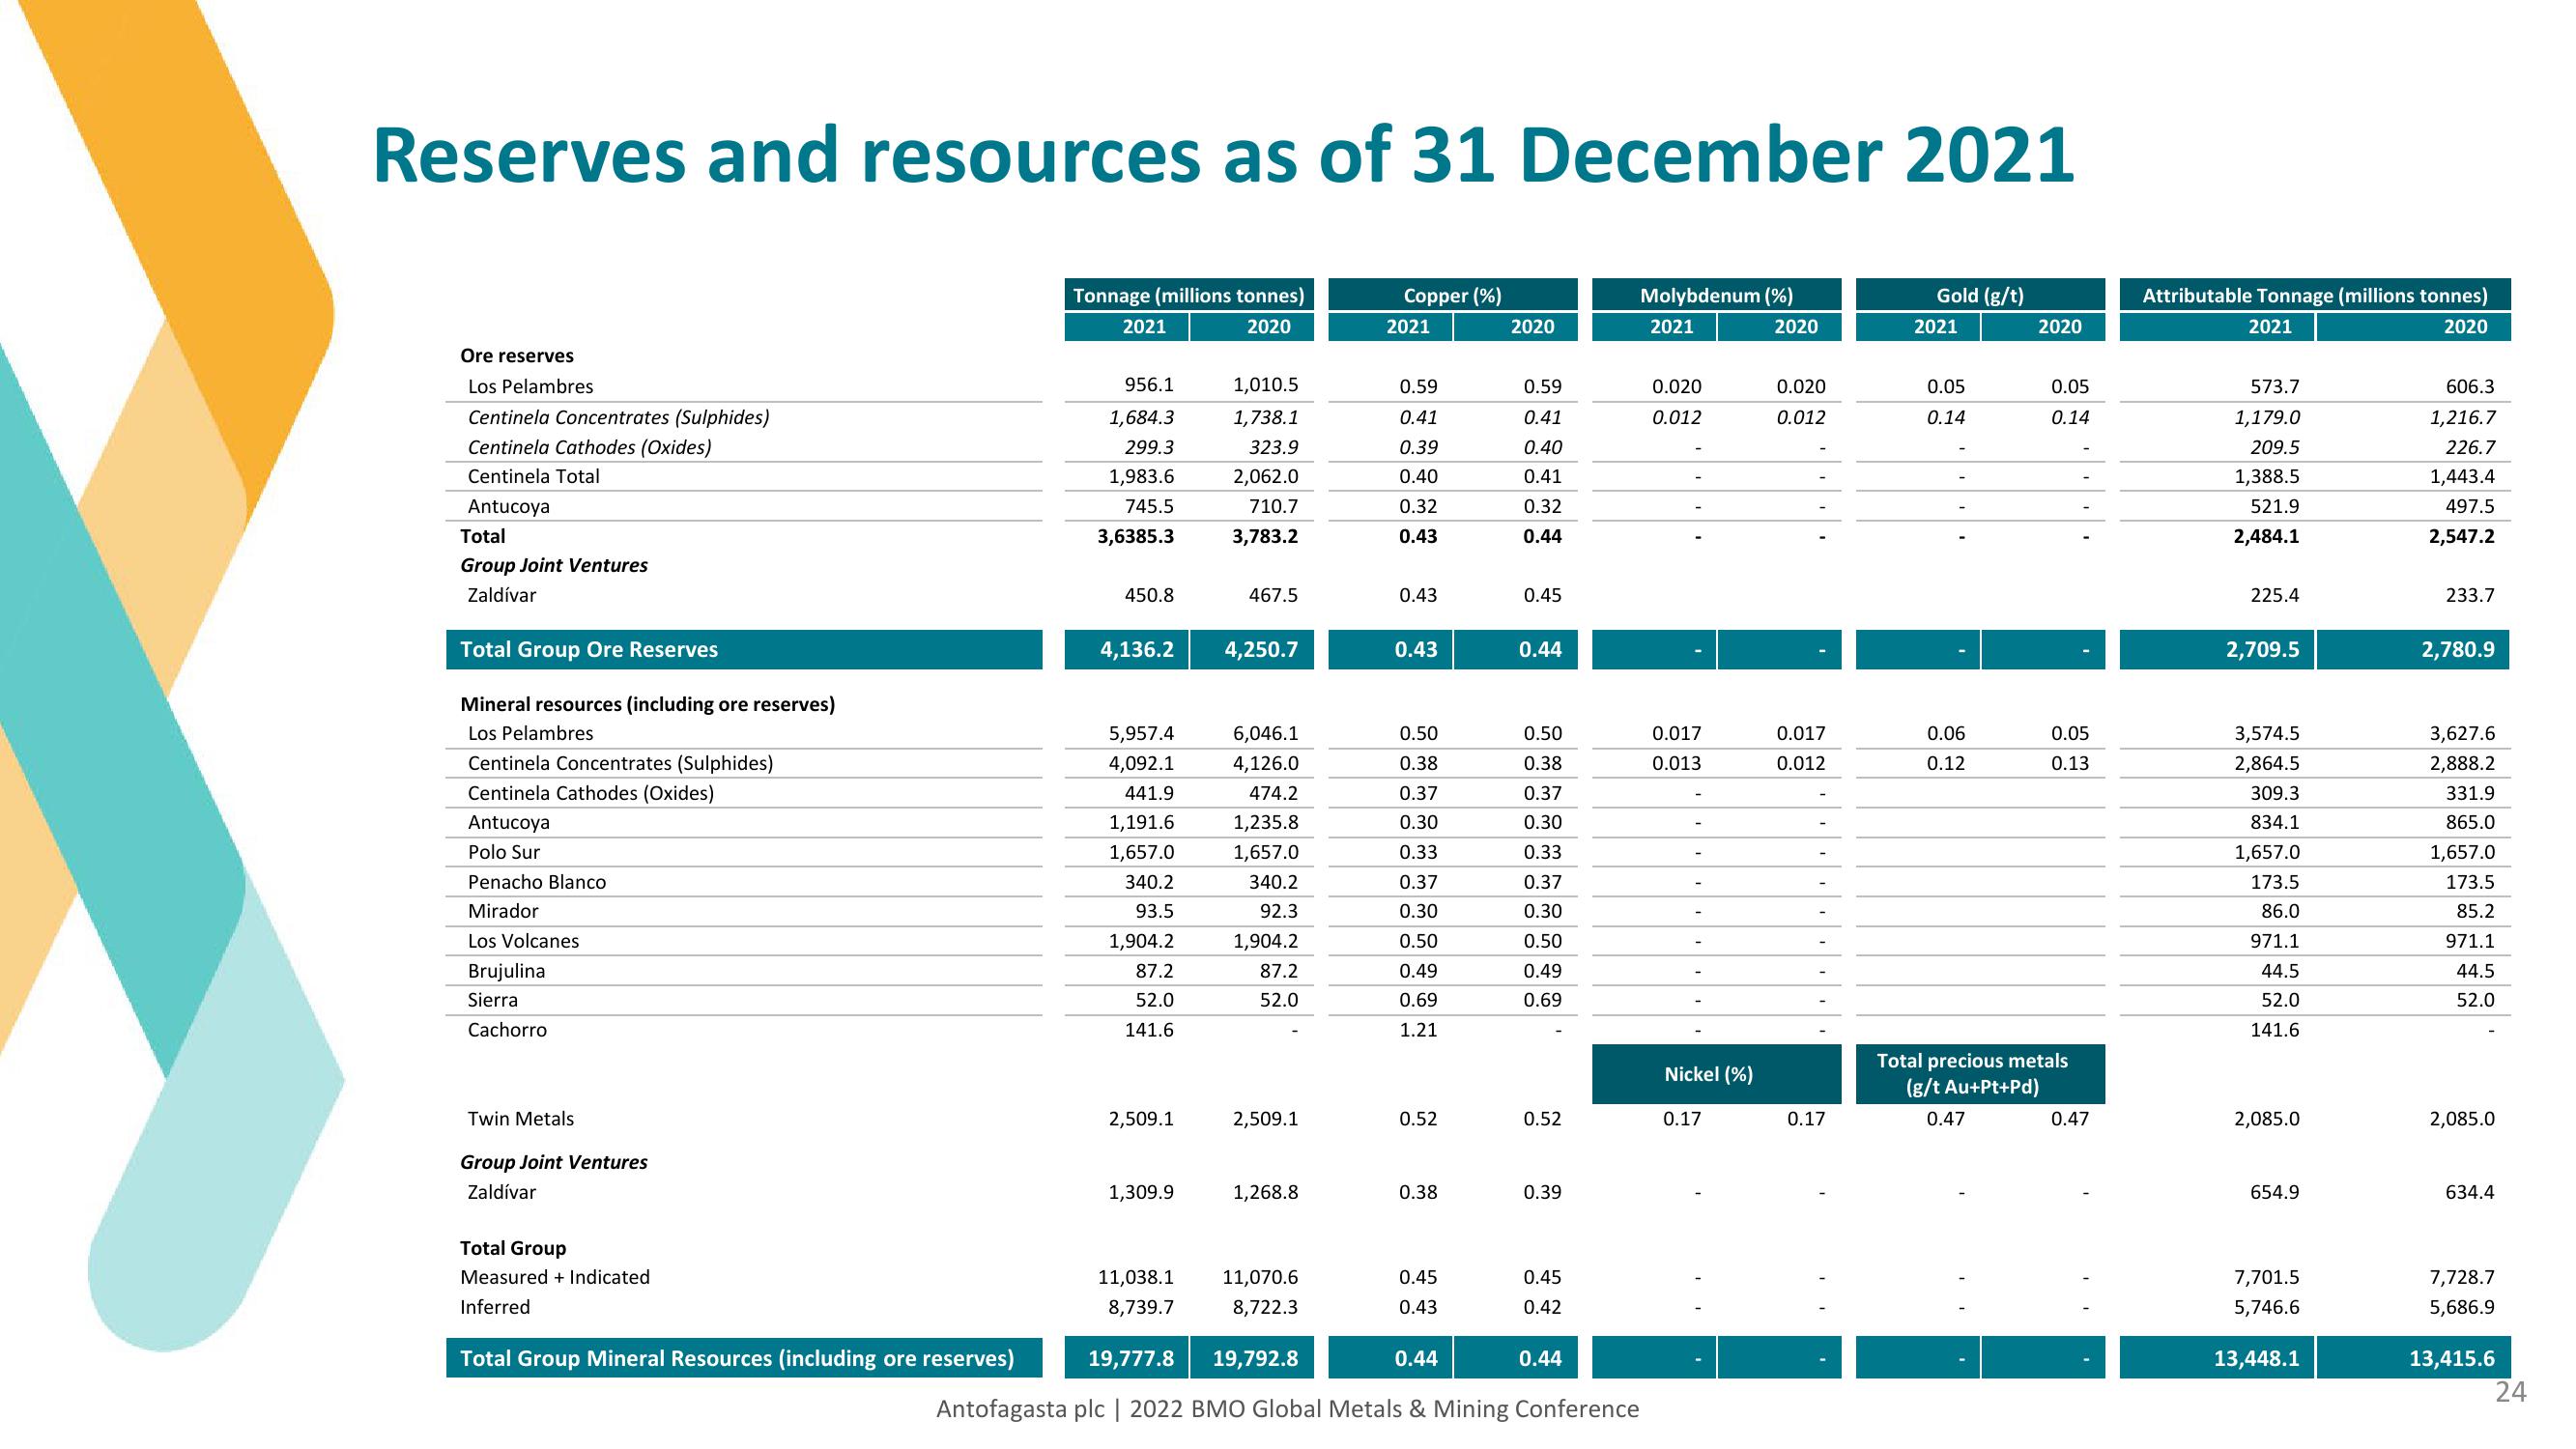
Reserves and resources as of 31 December 2021
Ore reserves
Los Pelambres
Centinela Concentrates (Sulphides)
Centinela Cathodes (Oxides)
Centinela Total
Antucoya
Total
Group Joint Ventures
Zaldívar
Total Group Ore Reserves
Mineral resources (including ore reserves)
Los Pelambres
Centinela Concentrates (Sulphides)
Centinela Cathodes (Oxides)
Antucoya
Polo Sur
Penacho Blanco
Mirador
Los Volcanes
Brujulina
Sierral
Cachorro
Twin Metals
Group Joint Ventures
Zaldívar
Total Group
Measured + Indicated
Inferred
Tonnage (millions tonnes)
2020
Total Group Mineral Resources (including ore reserves)
2021
956.1
1,684.3
299.3
1,983.6
745.5
3,6385.3
450.8
4,136.2
5,957.4
4,092.1
441.9
1,191.6
1,657.0
340.2
93.5
1,904.2
87.2
52.0
141.6
2,509.1
1,309.9
1,010.5
1,738.1
323.9
2,062.0
710.7
3,783.2
467.5
4,250.7
6,046.1
4,126.0
474.2
1,235.8
1,657.0
340.2
92.3
1,904.2
87.2
52.0
2,509.1
1,268.8
Copper (%)
2021
0.59
0.41
0.39
0.40
0.32
0.43
0.43
0.43
0.50
0.38
0.37
0.30
0.33
0.37
0.30
0.50
0.49
0.69
1.21
0.52
0.38
0.45
0.43
2020
0.44
0.59
0.41
0.40
0.41
0.32
0.44
0.45
0.44
0.50
0.38
0.37
0.30
0.33
0.37
0.30
0.50
0.49
0.69
0.52
11,038.1
8,739.7
11,070.6
8,722.3
19,777.8 19,792.8
Antofagasta plc | 2022 BMO Global Metals & Mining Conference
0.39
0.45
0.42
Molybdenum (%)
2021
0.44
0.020
0.012
0.017
0.013
Nickel (%)
0.17
2020
0.020
0.012
0.017
0.012
0.17
Gold (g/t)
2021
0.05
0.14
0.06
0.12
2020
0.05
0.14
0.05
0.13
Total precious metals
(g/t Au+Pt+Pd)
0.47
0.47
Attributable Tonnage (millions tonnes)
2021
2020
573.7
1,179.0
09.5
1,388.5
521.9
2,484.1
225.4
2,709.5
3,574.5
2,864.5
309.3
834.1
1,657.0
173.5
86.0
971.1
44.5
52.0
141.6
2,085.0
654.9
7,701.5
5,746.6
13,448.1
606.3
1,216.7
226.7
1,443.4
497.5
2,547.2
233.7
2,780.9
3,627.6
2,888.2
331.9
865.0
1,657.0
173.5
85.2
971.1
44.5
52.0
2,085.0
634.4
7,728.7
5,686.9
13,415.6
24View entire presentation