Procore IPO Presentation Deck
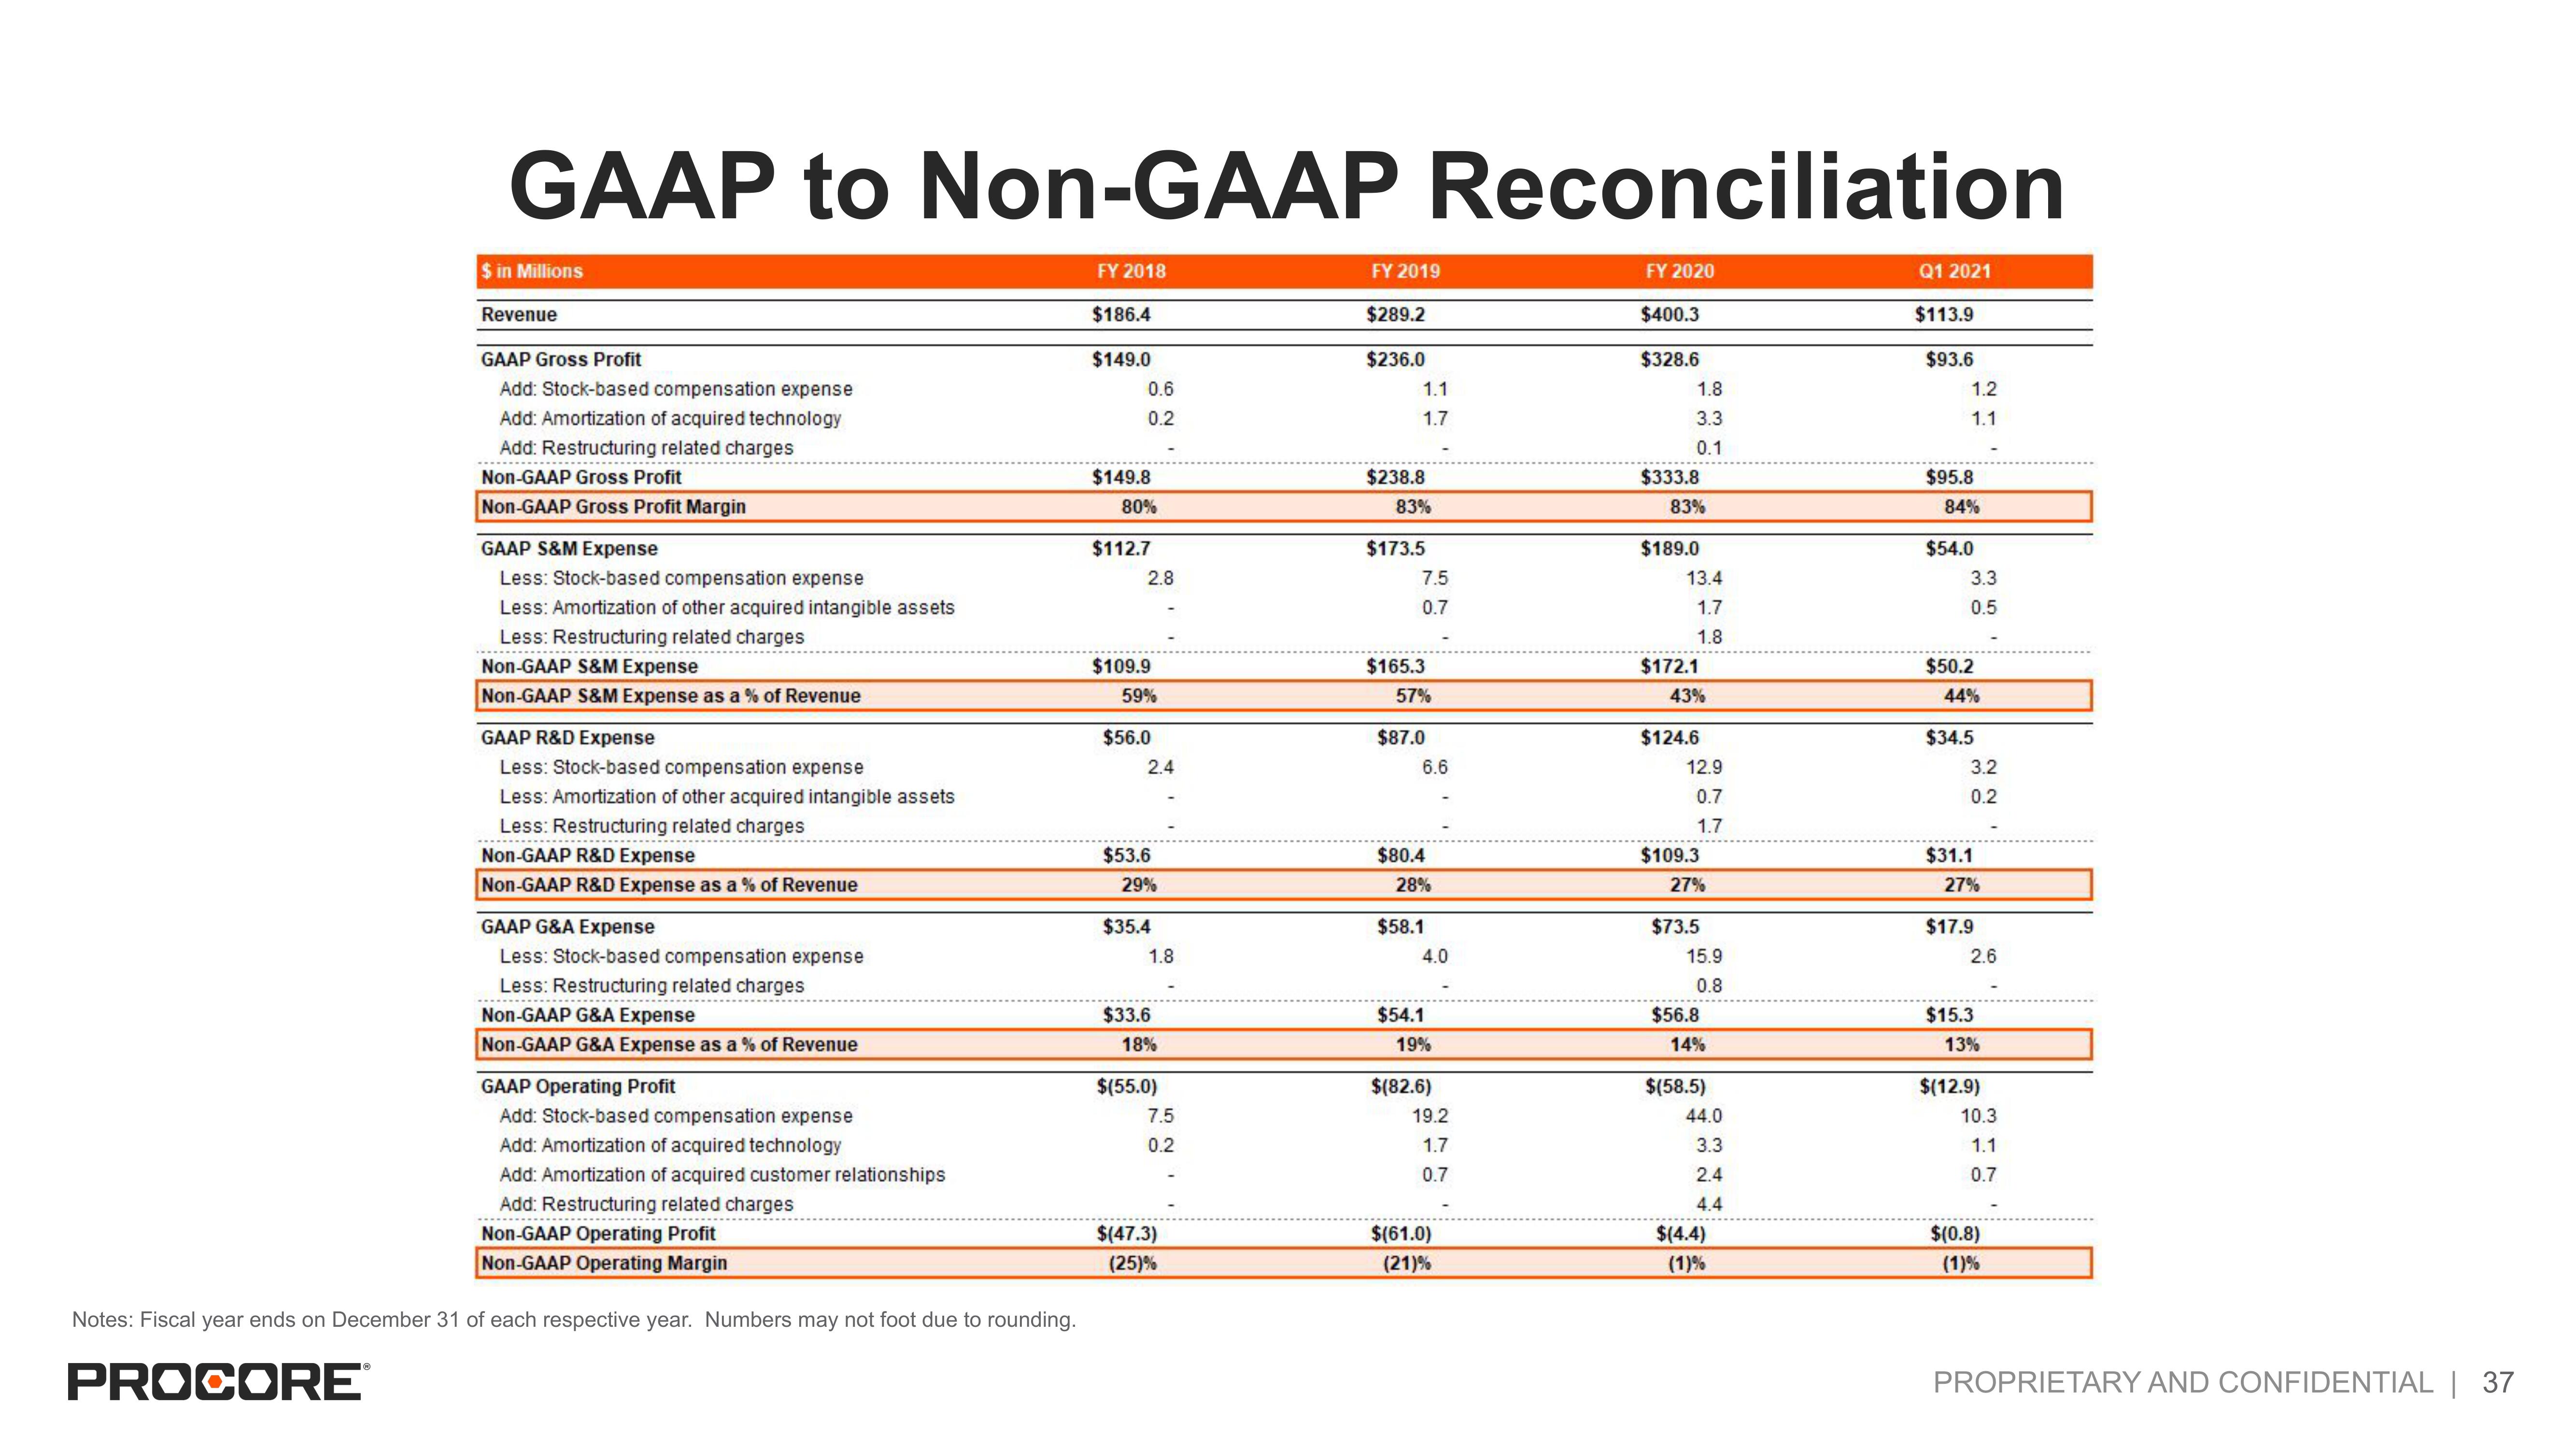
GAAP to Non-GAAP Reconciliation
$ in Millions
Revenue
GAAP Gross Profit
Add: Stock-based compensation expense
Add: Amortization of acquired technology
Add: Restructuring related charges
Non-GAAP Gross Profit
Non-GAAP Gross Profit Margin
GAAP S&M Expense
Less: Stock-based compensation expense
Less: Amortization of other acquired intangible assets
Less: Restructuring related charges
Non-GAAP S&M Expense
Non-GAAP S&M Expense as a % of Revenue
GAAP R&D Expense
Less: Stock-based compensation expense
Less: Amortization of other acquired intangible assets
Less: Restructuring related charges
Non-GAAP R&D Expense
Non-GAAP R&D Expense as a % of Revenue
GAAP G&A Expense
Less: Stock-based compensation expense
Less: Restructuring related charges
Non-GAAP G&A Expense
Non-GAAP G&A Expense as a % of Revenue
GAAP Operating Profit
Add: Stock-based compensation expense
Add: Amortization of acquired technology
Add: Amortization of acquired customer relationships
Add: Restructuring related charges
Non-GAAP Operating Profit
Non-GAAP Operating Margin
Notes: Fiscal year ends on December 31 of each respective year. Numbers may not foot due to rounding.
PROCORE®
FY 2018
$186.4
$149.0
0.6
0.2
$149.8
80%
$112.7
2.8
$109.9
59%
$56.0
2.4
$53.6
29%
$35.4
1.8
$33.6
18%
$(55.0)
7.5
0.2
$(47.3)
(25)%
FY 2019
$289.2
$236.0
1.1
1.7
$238.8
83%
$173.5
7.5
0.7
$165.3
57%
$87.0
6.6
$80.4
28%
$58.1
4.0
$54.1
19%
$(82.6)
19.2
1.7
0.7
$(61.0)
(21)%
FY 2020
$400.3
$328.6
1.8
3.3
0.1
$333.8
83%
$189.0
13.4
1.7
1.8
$172.1
43%
$124.6
12.9
0.7
1.7
$109.3
27%
$73.5
15.9
0.8
$56.8
14%
$(58.5)
44.0
3.3
2.4
4.4
$(4.4)
(1)%
Q1 2021
$113.9
$93.6
1.2
1.1
$95.8
84%
$54.0
3.3
0.5
$50.2
44%
$34.5
3.2
0.2
$31.1
27%
$17.9
2.6
$15.3
13%
$(12.9)
10.3
1.1
0.7
$(0.8)
(1)%
PROPRIETARY AND CONFIDENTIAL | 37View entire presentation