Lordstown Motors Investor Presentation Deck
Secular Tailwinds for both EVs and Trucks
Powertrain Weighting (% of Total US Vehicles)
3%
1%
2%
95%
2020E
5%
10%
20%
65%
2030E
60%
33%
2040E
■ICE & Other EV PHEV - HEV
5%
2%
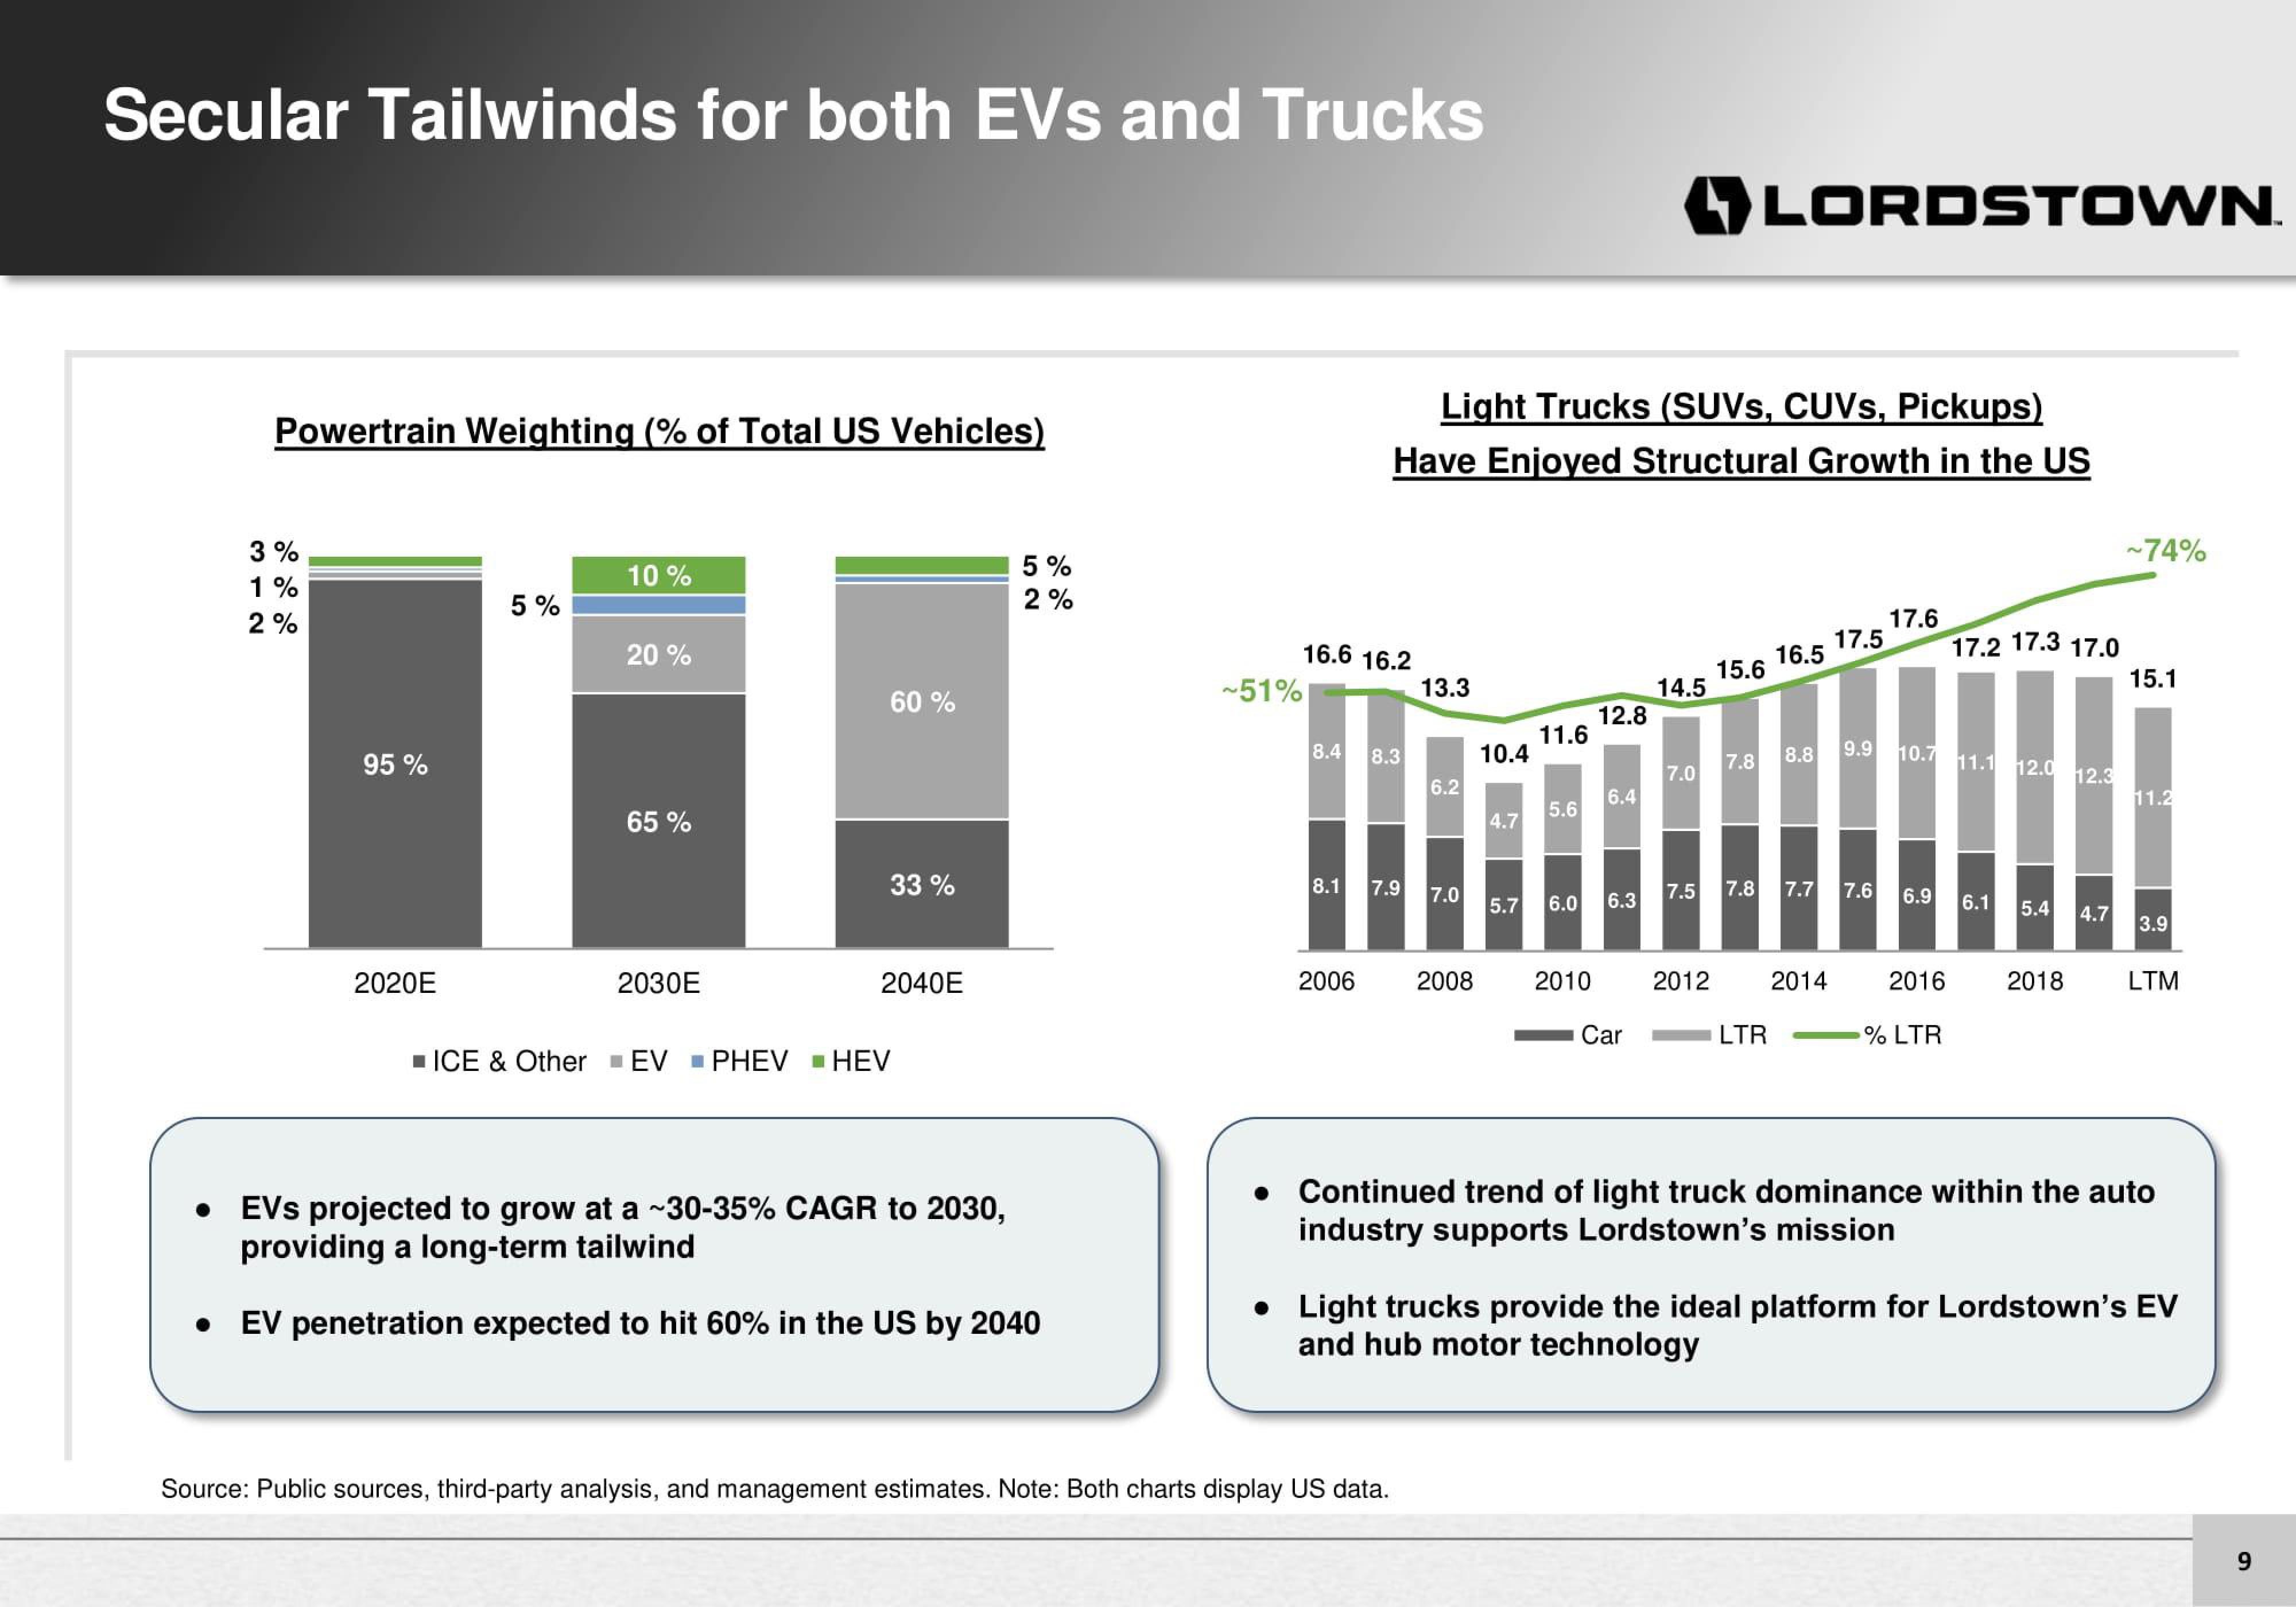
EVS projected to grow at a ~30-35% CAGR to 2030,
providing a long-term tailwind
• EV penetration expected to hit 60% in the US by 2040
~51%
16.6 16.2
8.4 8.3
Light Trucks (SUVs, CUVs, Pickups)
Have Enjoyed Structural Growth in the US
2006
13.3
8.1 7.9 7.0
6.2
Source: Public sources, third-party analysis, and management estimates. Note: Both charts display US data.
2008
10.4
4.7
5.7
11.6
5.6
12.8
2010
6.4
6.0 6.3
Car
14.5
7.0
7.5
2012
LORDSTOWN.
16.5
15.6
7.8 8.8
7.8
LTR
17.5
2014
7.7 7.6
17.6
9.9 10.7 11.1 12.0 12.3
11
6.9
17.2 17.3 17.0
2016
% LTR
6.1 5.4 4.7
2018
~74%
15.1
11.2
3.9
LTM
● Continued trend of light truck dominance within the auto
industry supports Lordstown's mission
• Light trucks provide the ideal platform for Lordstown's EV
and hub motor technology
9View entire presentation