TPG Results Presentation Deck
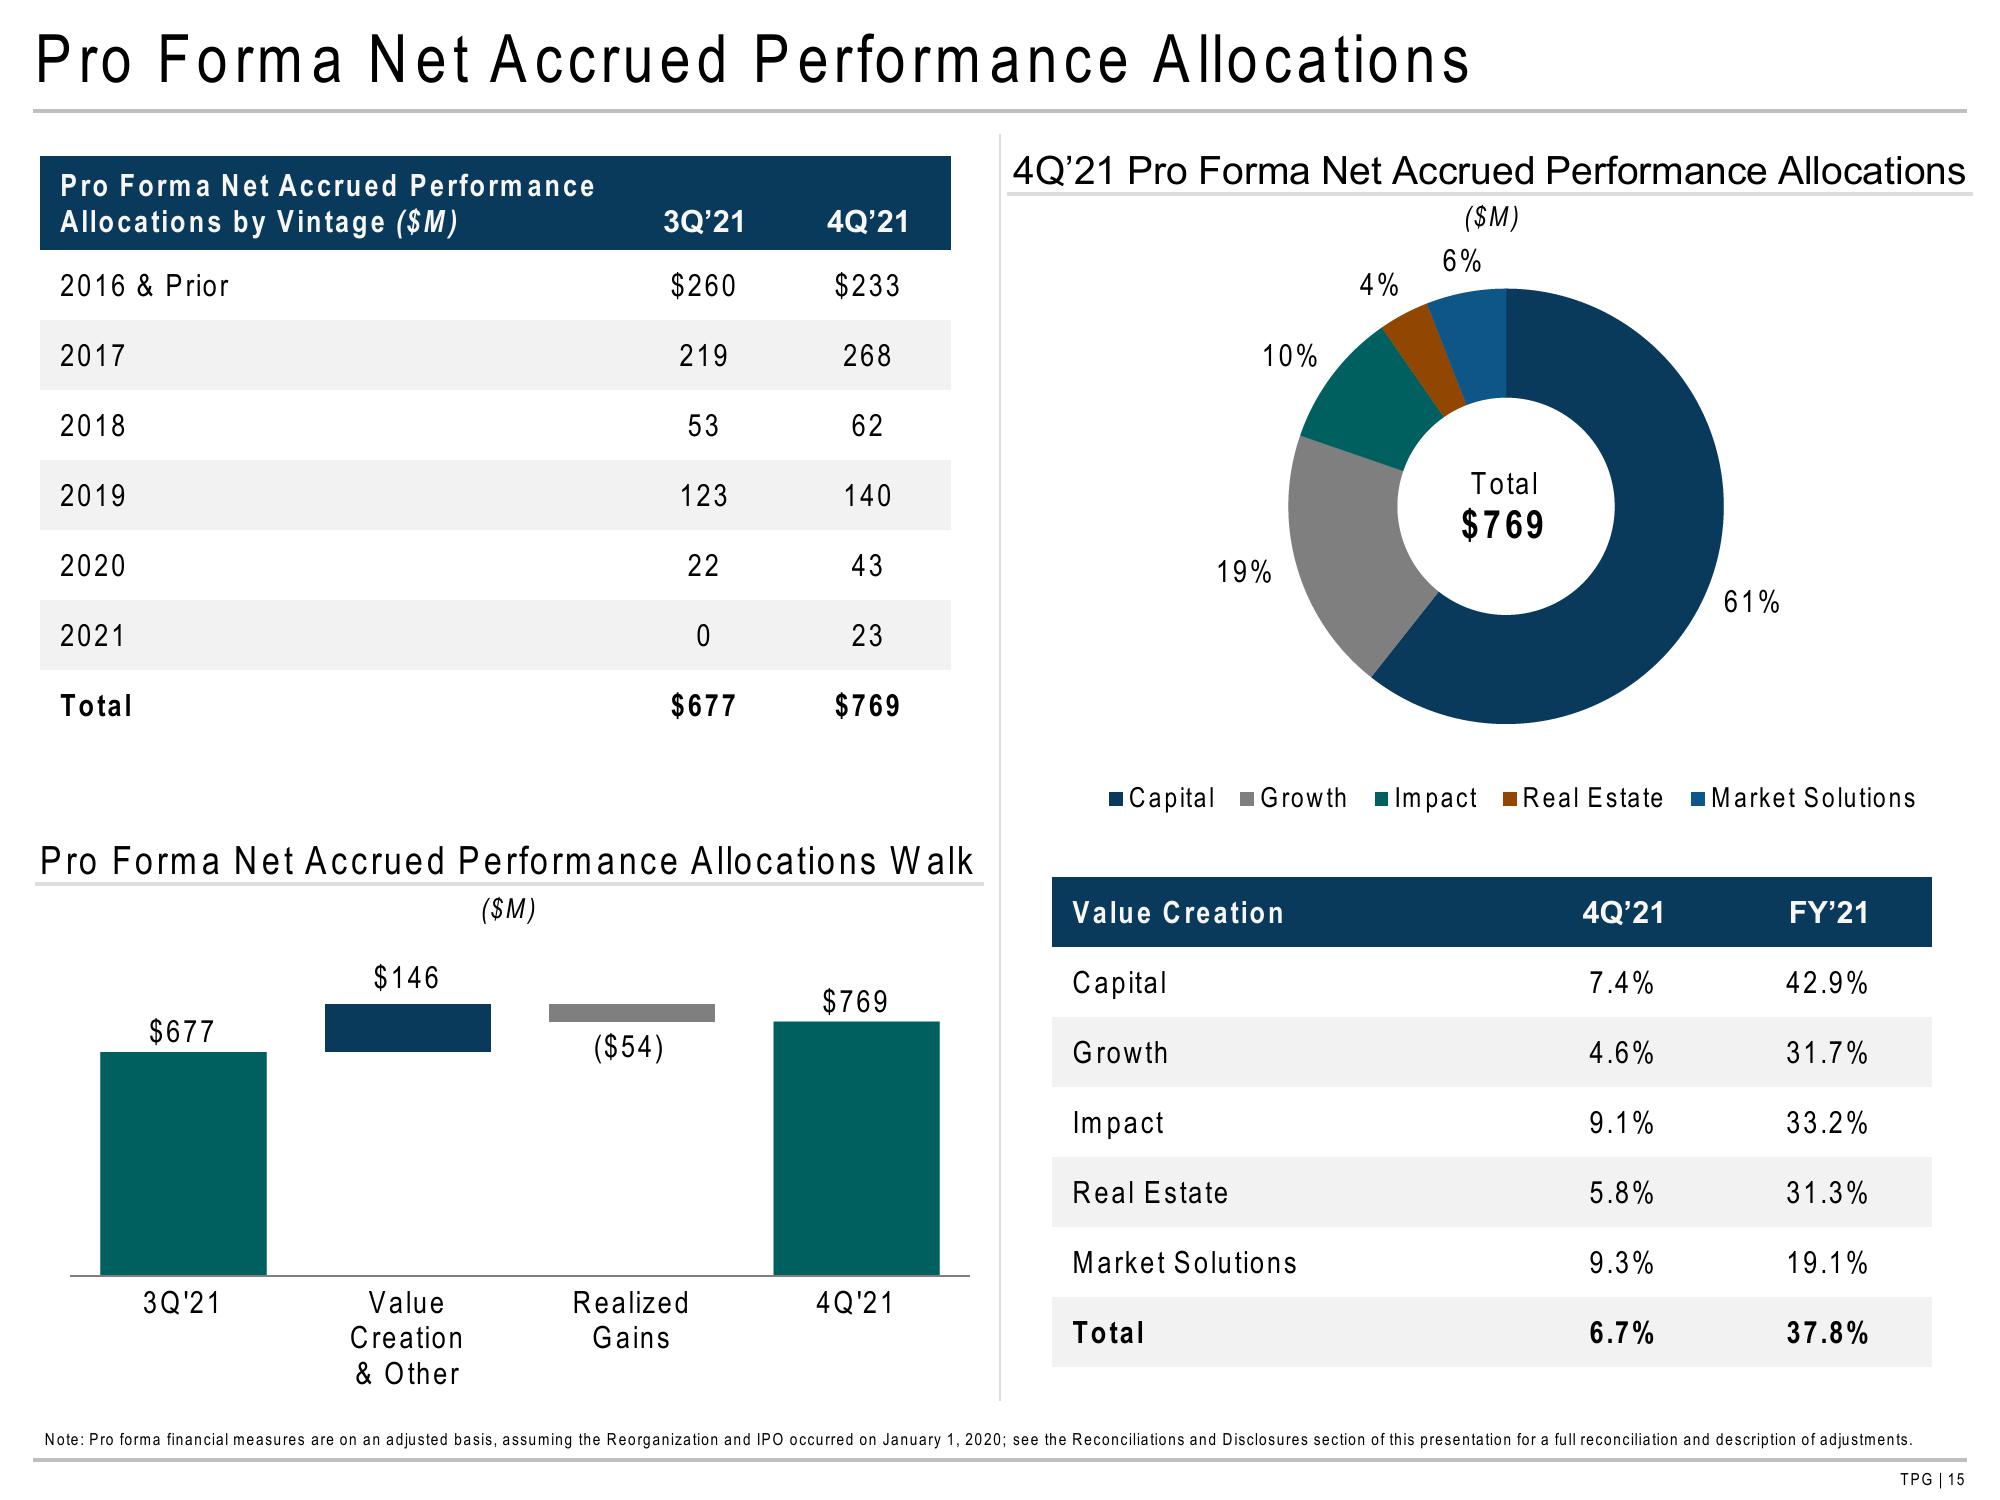
Pro Forma Net Accrued Performance Allocations
Pro Forma Net Accrued Performance
Allocations by Vintage ($M)
2016 & Prior
2017
2018
2019
2020
2021
Total
$677
3Q'21
$146
3Q'21
$260
Value
Creation
& Other
219
($54)
53
123
22
0
$677
Realized
Gains
4Q'21
$233
268
Pro Forma Net Accrued Performance Allocations Walk
($M)
62
140
43
23
$769
$769
4Q'21
4Q'21 Pro Forma Net Accrued Performance Allocations
($M)
10%
19%
Value Creation
Capital
Growth
Impact
Real Estate
4%
Capital Growth Impact Real Estate
Market Solutions
Total
6%
Total
$769
4Q'21
7.4%
4.6%
9.1%
5.8%
9.3%
6.7%
61%
■Market Solutions
FY'21
42.9%
31.7%
33.2%
31.3%
19.1%
37.8%
Note: Pro forma financial measures are on an adjusted basis, assuming the Reorganization and IPO occurred on January 1, 2020; see the Reconciliations and Disclosures section of this presentation for a full reconciliation and description of adjustments.
TPG | 15View entire presentation